Why An Endowment Could Be the Smartest Move

An Endowment Could be a Non-Profit’s Smartest Move

Imagine your non-profit having steady, reliable income to fund both your mission-driven programs and the essential overhead that keeps everything running for decades to come.  Imagine no more choosing between paying staff and delivering services. Imagine no more watching rising costs quietly erode your impact. Imagine no more depending entirely on donations and grants.

That future is not only possible, but it is also achievable through one of the most powerful (and underused) tools in non-profit finance: an endowment.

In an environment where costs continue to rise higher than usual due to persistent inflation, forward-thinking non-profit leaders are turning to endowments to create lasting financial strength. Here are the benefits and how even smaller organizations can get started.

Non-Profits Are Facing Real Cost Pressure

 Higher than usual inflation has significantly increased expenses across the sector. Salaries, benefits, rent, utilities, program supplies and insurance have all climbed, often faster than revenue can keep pace. At the same time, many traditional funding sources remain restricted to direct program costs. Donors and foundations frequently hesitate to cover overhead or administrative expenses even though these costs are essential to delivering high-quality work.

The result? Many non-profits find themselves in a constant cycle of fundraising just to maintain the status quo, with little room for innovation, reserves, or long-term planning. When economic conditions tighten or donations fluctuate, the pressure becomes even greater.

This is exactly why an endowment is no longer a nice-to-have for large institutions. It is becoming a strategic necessity for organizations that want to thrive, not just survive.

What Is an Endowment, Really?

 An endowment is a permanently invested fund designed to generate ongoing income for your organization. The principal is protected and grown over time, while a portion of the returns (typically 4 to 5 percent annually) is distributed each year to support operations.

Unlike one-time grants or annual appeals, endowment income is:

  • Reliable: it arrives predictably every year
  • Unrestricted: you decide how to use it (including overhead)
  • Sustainable: it continues indefinitely and can even grow

Think of it as planting a financial tree whose fruit can feed your mission for generations.

5 Powerful Benefits of Building an Endowment 

  1. Financial Stability in Uncertain Times Endowment income provides a buffer when donations slow, grants become more competitive, or inflation drives costs higher. It reduces the stress of making payroll and helps you plan with confidence.
  2. True Support for Overhead and Operations Because endowment distributions are usually unrestricted, you can finally fund the administrative and operational backbone that makes your programs possible without having to apologize for it.
  3. Greater Mission Focus When a portion of your budget is covered by endowment income, your team can spend less time chasing short-term funding and more time advancing your cause.
  4. Attracting Bigger, Longer-Term Gifts Major donors and foundations are increasingly drawn to organizations that demonstrate long-term financial planning. An endowment signals strength, professionalism, and commitment to sustainability.
  5. Legacy and Intergenerational Impact An endowment allows today’s supporters to create lasting impact. It ensures your mission can continue serving future generations, even as leadership and economic conditions change.

How to Start Building an Endowment (Even If You’re Small)

 Many non-profits assume endowments are only for large institutions with millions in assets. That is a myth.

Organizations of all sizes can begin, often by creating a board-designated quasi-endowment first, then transitioning to a formal endowment as the fund grows.

Here are the foundational steps:

  • Define your why: Clarify the specific impact you want endowment income to support (for example, core operations, innovation, or a particular program area).
  • Set clear policies: Establish an investment policy, spending policy, and gift acceptance policy (templates and guidance are available).
  • Start fundraising with intention: Create dedicated endowment giving opportunities and language for major donors and planned giving.
  • Invest prudently: Work with an advisor experienced in non-profit endowments to balance growth and preservation.
  • Begin with what you have: Even modest annual contributions or a single major gift can plant the seed.

The key is to start. The earlier you begin, the more time compounding returns have to work in your favor. If you are a non-profit leader who wants to move beyond year-to-year survival and build genuine financial resilience, an endowment is one of the highest-leverage strategies available.

The organizations that will still be thriving 20 or 30 years from now are the ones taking action today.

Download our free Non-Profit Endowment Launch Checklist a practical tool that includes:

  • A quick readiness self-assessment
  • Sample policy language
  • A 5-step launch roadmap
  • Key questions to discuss with your board
  • Simple fundraising language you can use right away

Get your free checklist here → https://equitas.capital/endowment

Building an endowment is not about hoarding money. It is about securing your mission so you can focus on the people and causes you serve.  Your future self (and the communities you serve) will thank you.

In 2002, Equitas Capital Advisors, LLC was established as a unique company that blends the resources of a large global corporation with the flexibility of a small boutique firm. The registered service mark of Equitas Capital Advisors is Engineering Financial Solutions®and the purpose of Equitas is to design, build, and deliver investment solutions to meet the goals and objectives of our investors. Equitas Capital Advisors, LLC located in New Orleans, has over 200 years of combined investment management consulting experience providing professional investment management services to investors such as foundations, endowments, insurance companies, oil companies, universities, corporate retirement plans, and high net worth family offices.

Disclosures and Disclaimers:

Above information is for illustrative purposes only and has been obtained from reliable sources but no guarantee is made with regard to accuracy or completeness. This information including any specific securities mentioned is for educational,  entertainment and illustrative purposes only and not a recommendation or solicitation to purchase or sell any individual security.  You cannot invest directly in an index. 

Equitas Capital Advisors, LLC is registered as an investment advisor with the U.S. Securities and Exchange Commission (“SEC”) and only transacts business in states where it is properly registered, or is excluded or exempted from registration requirements. SEC registration does not constitute an endorsement of the firm by the Commission nor does it indicate that the advisor has attained a particular level of skill or ability.

 Information presented is believed to be factual and up-to-date, but we do not guarantee its accuracy and it should not be regarded as a complete analysis of the subjects discussed. All expressions of opinion reflect the judgment of the author on the date of publication and are subject to change. This publication does not involve the rendering of personalized investment advice.

Past performance may not be indicative of future results. Therefore, no current or prospective client should assume that the future performance of any specific investment or strategy will be profitable or equal to past performance levels.  All investment strategies have the potential for profit or loss. Changes in investment strategies, contributions or withdrawals, and economic conditions may materially alter the performance of your portfolio. Different types of investments involve varying degrees of risk, and there can be no assurance that any specific investment or strategy will be suitable or profitable for an investor. Charts and references to returns do not represent the performance achieved by Equitas Capital Advisors, LLC, or any of its clients.

Asset allocation and diversification do not assure or guarantee better performance and cannot eliminate the risk of investment losses. All investment strategies have the potential for profit or loss. There can be no assurances that an investor’s portfolio will match or outperform any particular benchmark.


The Truth About Capitalism

David Thomas Guest column: The Truth About Capitalism


Read the full article at NOLA.COM

>

Capitalism has lifted more people out of poverty than any other economic system in history. Communist China proved this. While maintaining its communist political structure, China embraced capitalistic market reforms in the late 1970s. According to the World Bank, those reforms helped more than 800 million citizens escape poverty, which is the largest economic transformation ever recorded. Yet despite its success, capitalism has its faults….


Read the full article at NOLA.COM

In 2002, Equitas Capital Advisors, LLC was established as a unique company that blends the resources of a large global corporation with the flexibility of a small boutique firm. The registered service mark of Equitas Capital Advisors is Engineering Financial Solutions® and the purpose of Equitas is to design, build, and deliver investment solutions to meet the goals and objectives of our investors. Equitas Capital Advisors, LLC located in New Orleans, has over 200 years of combined investment management consulting experience providing professional investment management services to investors such as foundations, endowments, insurance companies, oil companies, universities, corporate retirement plans, and high net worth family offices.

Disclosures and Disclaimers:
Above information is for illustrative purposes only and has been obtained from reliable sources but no guarantee is made with regard to accuracy or completeness. It is not an offer to sell or solicitation to buy any security. The specific securities used are for illustrative purposes only and not a recommendation or solicitation to purchase or sell any individual security.

Equitas Capital Advisors, LLC is registered as an investment advisor with the U.S. Securities and Exchange Commission (“SEC”) and only transacts business in states where it is properly registered, or is excluded or exempted from registration requirements. SEC registration does not constitute an endorsement of the firm by the Commission nor does it indicate that the advisor has attained a particular level of skill or ability.

Information presented is believed to be factual and up-to-date, but we do not guarantee its accuracy and it should not be regarded as a complete analysis of the subjects discussed. All expressions of opinion reflect the judgment of the author on the date of publication and are subject to change. This publication does not involve the rendering of personalized investment advice.

Charts and references to returns do not represent the performance achieved by Equitas Capital Advisors, LLC, or any of its clients.

Asset allocation and diversification do not assure or guarantee better performance and cannot eliminate the risk of investment losses.

All investment strategies have the potential for profit or loss. There can be no assurances that an investor’s portfolio will match or outperform any particular benchmark. Past performance does not guarantee future investment success.

Trees Do Not Grow to Space

SpaceX launched their historic IPO on June 12, 2026, the largest in history with the company’s valuation surpassing $2 trillion. In their wake, it is tempting to believe that some trees can really grow all the way to space.

The history of the market delivers a consistent reminder: neither trees nor stocks grow to the sky or to space. Assumptions of infinite growth within our finite reality have proven costly time and again. The popular backward-looking CAPE ratio currently sits near 42. Levels this high are typically associated with lower average future returns for equities. Forward Earnings multiple charts show similar levels of historic highs.

Bulls argue that this time is different. They contend that AI-driven earnings growth has and will continue to justify valuations. Bears counter that return to normal is inevitable and that the higher the peak, the steeper the potential decline. The chart below demonstrates how stock prices for the S&P 500 have grown compared to the actual company earnings behind them over time.

S&P 500 stock price growth compared to underlying company earnings over time

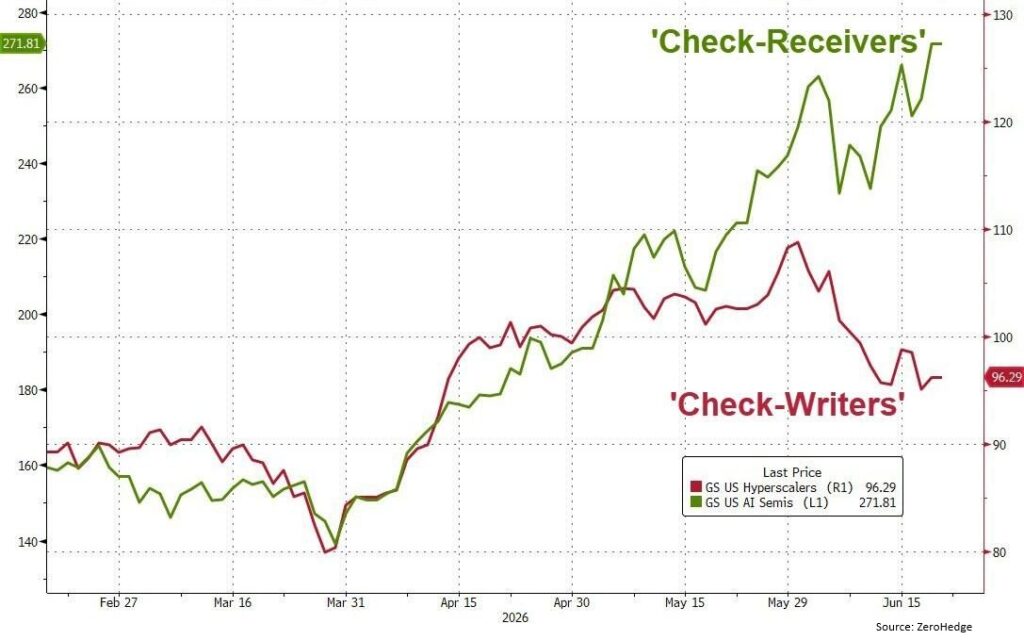
A critical question is whether corporate earnings, particularly within the AI ecosystem, can grow fast enough to validate current prices. Currently, the answer is increasingly split in two. The chart on the next page captures a clear difference: Check-Receivers (primarily AI chip makers) have continued powering higher, while Check-Writers (the largest companies footing the multi-hundred-billion-dollar bill) have shown relative weakness in recent months.

Stock performance divergence between AI chip suppliers (Check-Receivers) and major AI spenders (Check-Writers)

The “picks and shovels” suppliers capture disproportionate early profits. Meanwhile the heavy spenders face margin pressure, over-building fears, and the reality that meaningful return on investment takes time to materialize at scale. AI-related spending for 2026 remains elevated, with estimates in the $500 to $700 billion-plus range across major players. Growth rates in spending are already decelerating in places, and power availability is emerging as a hard constraint.

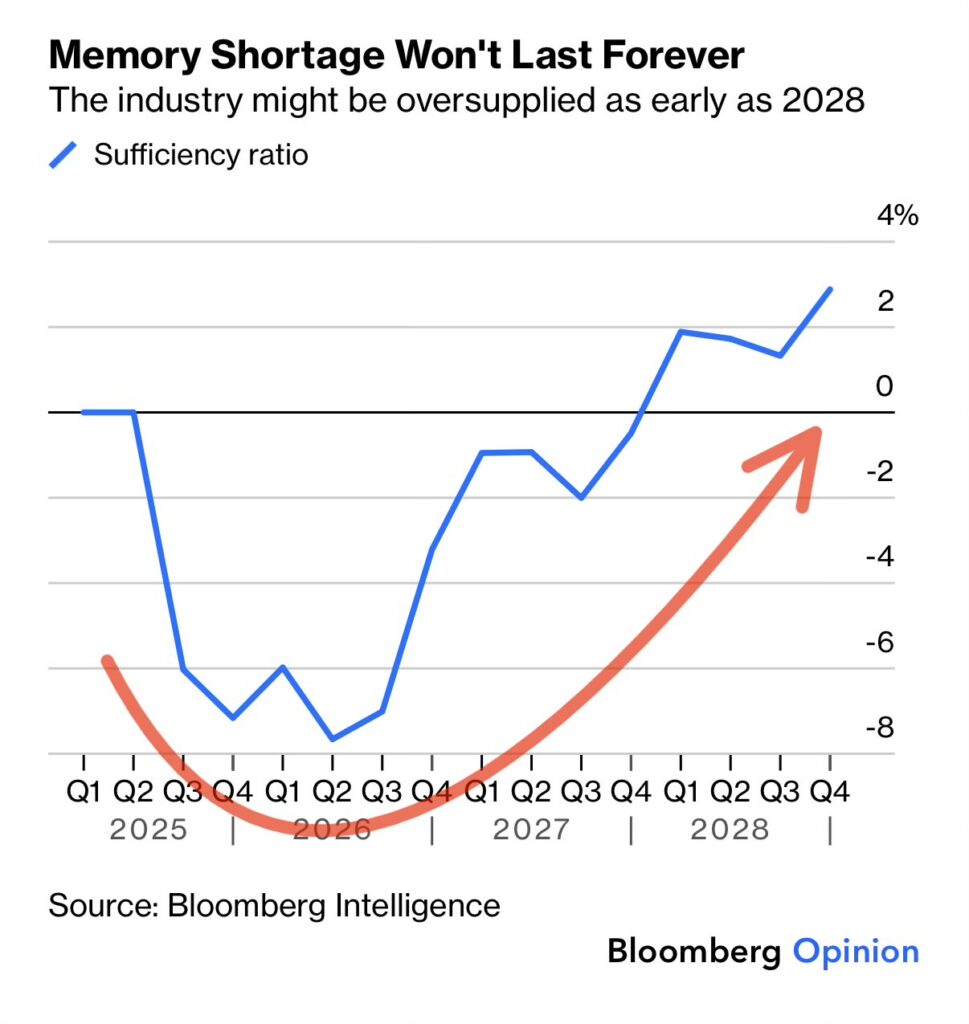
The AI buildout has created one of the strongest memory and semiconductor cycles in history. Memory demand has tightened supply for conventional chips and driven dramatic price increases. Suppliers are effectively sold out through 2026 and 2027 in many segments. Cycles have peaks and valleys. The Bloomberg Intelligence chart below demonstrates the supply and demand balance for memory turning decisively higher as new factories are slated to start production starting late 2027 into 2028. If AI demand growth moderates even modestly, or if power and infrastructure bottlenecks bite harder, the industry could shift from shortage to balanced or outright oversupplied faster than consensus expects.

Bloomberg Intelligence chart of memory chip supply and demand balance turning higher into 2027–2028

We are not calling an imminent bust. The structural tailwinds from AI are powerful and multi-year. The rate of change in the cycle is susceptible to slowing down, however, and investors assuming that shortages and high prices last forever may be disappointed. The big three memory makers (Samsung, SK Hynix, Micron) are tightening their spending discipline. History has shown that every memory supercycle eventually normalizes, often abruptly.

Broader Market Backdrop: Rates, Housing and Labor

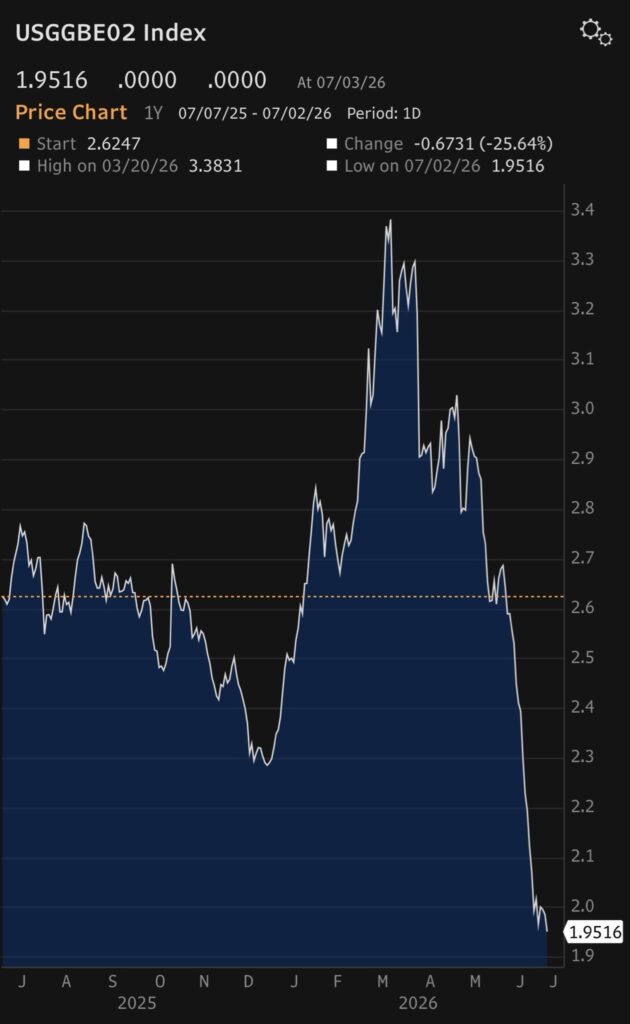
Inflation expectations, and their impacts on interest rates, have exhibited significant volatility. Recent moves reflect evolving expectations around the timing and extent of any Fed easing or potential hiking. In the latest Fed communication, the new Federal Reserve Chair, Kevin Warsh, used firm language to promise price stability. Investors now expect fewer interest rate cuts than earlier anticipated, and even the possibility of an increase. Inflation expectations, increased due to the conflict in the Middle East, have normalized due to calming hostilities and rate hawkishness. The chart on the right shows expected future inflation by comparing regular Treasury bonds with special inflation-protected bonds.

Housing and Demographics. The median age of U.S. homebuyers has continued its steady climb. First-time buyers now approach a median age of 40, while repeat buyers are typically in their late 50s to early 60s. This is more than a demographic curiosity. It signals persistent affordability challenges, high mortgage rates locking in existing homeowners, and delayed wealth-building for younger generations. The long-term implications for consumption, family formation, and the political economy are profound. A record peak in 630,000 more sellers than buyers in March has narrowed slightly in recent months but remains a concern.

Expected future inflation implied by comparing Treasury bonds with inflation-protected bonds

Labor Market. The classic unemployment rate recently stopped its slow march upwards, a stabilizing sign for the economy and markets. However, the change in the labor force participation rate shows recent softening after the post-pandemic recovery. While this alone does not signal an upcoming recession, employment softness is a sign of stress which should be monitored closely.

Risk Management in the Later Innings

SpaceX’s achievement is extraordinary and deserves celebration. It demonstrates what focused execution, capital allocation, and technological ambition can accomplish. The company’s public market debut also serves as a timely reminder. Even the most successful ventures trade at valuations that embed heroic assumptions about future growth. Post-IPO moderation in the stock price is a healthy reminder that gravity eventually applies.

Across the broader market we see several factors:

  • Valuations at levels that have historically delivered poor forward returns.
  • AI earnings leadership concentrated in a handful of enablers while spenders face ROI scrutiny.
  • Hardware and memory cycle still strong but with clear visibility to capacity-driven normalization by 2028.
  • Policy rates volatile and continued inflation uncertainty.
  • Real economy signals (housing affordability, labor participation) showing strain.

We remain constructive on the long-term transformative power of AI and related technologies. We advocate heightened risk awareness in portfolio construction. This includes maintaining discipline on valuation, favoring quality companies with durable strategic advantages and reasonable entry points, diversifying as much as reasonable, and stress-testing for scenarios of slowing growth and/or falling valuations.

Trees do not grow into space. Markets do not either. The investors who thrive over full cycles are those who recognize when the canopy is getting thin and position themselves to act accordingly.

The Dark Side of Dollar Cost Averaging

Most investors understand the power of dollar-cost averaging when building wealth: investing a fixed dollar amount each month buys more shares when prices are low and fewer when they are high. It is a disciplined way to accumulate assets over time. Yet the exact opposite process, reverse dollar-cost averaging (RDCA), quietly undermines far too many portfolios, especially Institutions with a spending policy and even retirees who use their portfolio for income. When investors sell a fixed dollar amount from their holdings to meet spending needs, they are forced to sell more shares precisely when prices are depressed. The result is a permanent reduction in future growth potential, even if markets eventually recover.

This is not a theoretical concern. It is the sequence-of-returns risk in action, amplified during recessions. Raising cash by liquidating equities at the bottom of a downturn locks in losses that compounding can never fully repair. The damage is especially acute for portfolios that rely entirely on stocks for growth and liquidity.

Consider a straightforward investor with a $1 million portfolio and income requirements of $50,000 per year. Many non-profits are required to spend 5% a year to keep their tax-free status, and $50,000 is a reasonable income from investments for many retirees. A 50% market decline is a real risk to every equity portfolio. Investors experienced a devastating drawdown this large in the 2008-2009 financial crisis, the dot-com crisis, and in the ’70s. At the bottom in a bear market that severe, the original portfolio from our example is worth only $500,000. To raise the required $50,000, the investor must now sell double the shares (10%) just to balance the books. When the market eventually recovers to its pre-crash level (typically 3 years later on average), those remaining shares are worth only $750,000. A flexible investor could raise the same $150,000 at that point and end up $100,000 ahead of the reverse-dollar-cost-averaging (RDCA) investor. The $100,000 difference is gone forever — simply because shares were sold at depressed prices.

The portfolio is permanently impaired, and future withdrawals become even more burdensome on a smaller base.

The math remains unforgiving across longer periods. Multiple recessions, or even a single prolonged bear market combined with steady withdrawals, can turn an otherwise sustainable portfolio into one that runs dry decades sooner than planned. A study from Franklin Wealth indicates that RDCA can cause over 2% loss per year during average market conditions. This is why RDCA ranks among the most expensive and widespread mistakes retirees make.

Fortunately, several practical strategies can neutralize or greatly reduce the damage. One effective approach is to maintain a dedicated counter-cyclical asset bucket — typically high-quality bonds or certain commodities such as gold or Treasury Inflation-Protected Securities. During equity market stress these assets often hold value or even appreciate, providing a ready source of cash without touching depressed stock holdings. Rebalancing periodically restores the equity exposure once markets stabilize, allowing the portfolio to participate fully in the eventual recovery.

A second line of defense is proactive risk management designed to limit the severity of drawdowns in the first place. This can include diversified equity strategies with built-in hedges, tactical allocation rules, or simply a more conservative overall stock-to-bond mix calibrated to the investor’s time horizon and risk tolerance. The goal is not to eliminate volatility but to keep the portfolio’s maximum loss within a range that does not force large-scale selling at the worst possible moment.

Engineering a portfolio based around dividend and interest income offers a third, complementary solution. Portfolios constructed around high-quality dividend-paying companies or bond ladders can generate a meaningful portion of required spending without any need to sell principal. While dividends are not immune to cuts in severe recessions, the cash flow they provide still reduces reliance on forced sales compared with pure total-return strategies.

Most investors benefit from some combination of the above rather than any single silver bullet. The precise mix depends on individual circumstances, but the common thread is deliberate separation of the spending layer from the growth layer of the portfolio.

Ultimately, the best protection against reverse dollar-cost averaging begins long before the next recession. An Investment Policy Statement (IPS) is one of the most important yet often overlooked tools in both personal and professional investing. At its core, an IPS is a written document that clearly defines your investment goals, the strategy you will use to achieve them, and the rules that will guide your decisions over time. While it may sound like something only formal institutions need, an IPS is just as valuable for wealthy and high net worth investors seeking clarity, discipline, and long-term success. Its primary value lies in its ability to remove emotion from the equation, ensuring that long-term financial health is prioritized even during periods of extreme market volatility.

The IPS typically begins with establishing a framework for governance and responsibilities. It defines the investor and the structure including delegating who is responsible for making decisions, implementing strategy, and overseeing performance. While individuals may simply clarify whether they are self-managing or working with an advisor, institutions typically outline roles for boards, investment committees, and external managers. This governance structure promotes accountability and reduces the risk of unclear or conflicting decision-making.

Additionally, an IPS will also typically outline the overall investment performance objective for the fund, balancing return with risk tolerance – how much growth is needed and how much volatility can be comfortably endured. It clearly outlines the constraints that shape a portfolio, such as time horizons, liquidity needs, tax considerations, legal or regulatory requirements, and other unique circumstances. By defining these boundaries upfront, the IPS ensures that every investment serves a specific purpose rather than being a reactive response to market trends.

Beyond high-level goals, the document provides portfolio guidelines for asset allocation. This section outlines how assets should be allocated across different investment categories, such as equities, fixed income, and alternative investments. It also specifies permitted investments, diversification requirements, and rebalancing rules.

Ultimately, the IPS is a living document that requires regular monitoring and review to stay aligned with changing life circumstances or shifting financial goals. By establishing benchmarks for success and clear procedures for oversight, it provides discipline, clarity, and consistency to the investment process. Markets are inherently uncertain, and both individual and institutional investors are susceptible to emotional or short-term decision-making. An IPS acts as a steady guide, helping investors stay focused on long-term objectives even during periods of volatility. It also enhances transparency and accountability, particularly in institutional contexts where multiple stakeholders are involved.

Investors who treat reverse dollar-cost averaging as the serious risk it is (and who build their portfolios and policies accordingly) position themselves to weather recessions without permanently impairing their organizational or retirement security. In the end, the difference between a portfolio that merely survives and one that truly thrives often comes down to one simple discipline: avoid selling at the bottom if at all possible.

When Capitalism Fails: What the Engine Tells

Capitalism has lifted more people out of poverty than any other economic system in history. The Communist Party of China proved this. While maintaining its communist political structure, China embraced capitalistic market reforms in the late 1970s. According to the World Bank, those reforms helped more than 800 million citizens escape poverty — the largest economic transformation ever recorded. Yet despite all its success, capitalism is not flawless.

Capitalism is an efficient economic system because it works directly off consumer needs and delivers supply where there is demand in pursuit of profit. The question is not whether capitalism works, but when and why it fails. As a lifelong believer and participant in capitalism, I have started four profitable companies. Beginning at age nine, I mowed every lawn in my neighborhood for $3 a yard. How else was I going to buy that Schwin Stingray bike with butterfly handlebars and a banana seat? That same yard today may pay $50, yet many young people seem reluctant to embrace this type of entrepreneurship. Perhaps this is because the youth do not yet recognize the difference between capitalism’s virtues and vices.

Consider tobacco, for example. In the 1500s tobacco was considered harmless and even prescribed by physicians to ease headaches and calm patients. By the 1930s, researchers such as our own Alton Ochsner uncovered evidence linking tobacco to cancer. Competing arguments clashed for decades: the industry insisted on safety, while science revealed the risks. Eventually, the truth prevailed — tobacco causes cancer. So how does the industry still thrive worldwide as a $912‑billion enterprise employing thousands while supplying a harmful product? Here capitalism shows its blind spot: it responds to demand, not morality. It is only if the demand declines that capitalism kicks in and brings down the supply.

This pattern repeats elsewhere but with different outcomes. Kodak dominated the photography industry for eighty years but failed to adapt to the new digital technology, ironically invented by one of its own engineers. Although the product was not harmful, when the demand dried up capitalism punished the company with bankruptcy. In contrast, the tobacco industry survives because the demand persists even though the product is harmful. Capitalism can be brutally efficient, but it is not a moral compass.

Government intervention has good intentions but fails to protect consumers as well. The first narcotics act passed in 1914 and with the Controlled Substances Act of 1970 sought to curb drug abuse. Yet according to the National Center for Health Statistics drug overdoses claimed 80,391 lives in the USA last year, double automobile fatalities, and is a leading cause of death in ages 18 to 44. Even with a US aircraft carrier positioned in the Caribbean, the illegal drug trade continues because the demand continues. There are many other examples like this such as Prohibition enacted in 1920. Government intervention failed again and it was repealed in 1933 when public demand won and capitalism delivered the supply without any ethical judgement. When demand is strong, capitalism operates in the gap and will go wherever the money flows. Ultimately, the responsibility lies with each of us to make wise choices and demand beneficial products that shape a healthier future. If we do, capitalism will be more than happy to provide them.

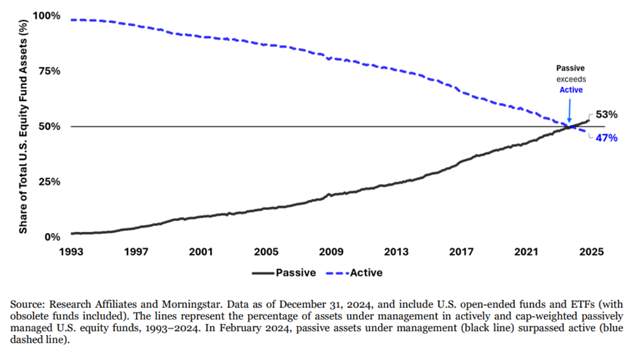
As wealth advisors, we must apply this same supply-and-demand logic to the stock market itself. In an ideal world, a company’s stock price would perfectly reflect its earnings and fundamental value. However, popular demand for stocks often pushes prices faster and higher than efficiency alone would suggest. Today, the market is increasingly driven by “Technical Demand” rather than “Fundamental Value.” This shift is fueled by passive fund flows, where trillions of dollars automatically buy the largest stocks simply because they are already large. When you add the influence of retail investors and algorithmic traders who buy based on mathematical patterns, the “technicals” become more important than ever. Some studies now suggest that these technical flows can impact stock prices more than the actual profits of the company.

Growth of passive fund flows into large-cap stocks driving technical demand

Looking back at 2025, we saw this momentum in action across all major asset classes. It was a year of resilience where boring metals like gold and silver were the standout winners, returning roughly 64% and 145% as investors sought safety. International developed and emerging markets surprised many with +30% returns, finally breaking a long streak of lagging behind the United States. The U.S. S&P 500 remained robust with an 18% gain led by the continued expansion of artificial intelligence. Meanwhile, cash and treasuries provided a modest 3.5% anchor, and real estate struggled under the weight of high interest rates, returning just under 3%. This “everything rally” was a testament to the market’s ability to find growth even in a high-rate environment.

As we enter 2026, the prevailing theme is one of continued US Excellence. We expect American companies to remain global leaders in innovation, particularly as AI moves from a concept into a core driver of earnings. However, our fiduciary duty is to watch for changing tides. While we remain invested in these growth stories, we are carefully monitoring the technical signals alongside the fundamentals. When too much money flows into too few stocks, the market becomes vulnerable to shifts in sentiment. Our strategy is to embrace the power of the capitalistic engine while remaining vigilant of its blind spots.

Playing with Fire: A Guide to Sky-High Stocks

Equitas Capital’s Guide to Sky-High Stocks

As we end the third quarter of 2025, the U.S. stock market faces an unusual situation. Stock prices are at historic highs, higher than almost any other time in history. However, the economy underneath remains healthy. Investors are conflicted. Many are both nervous of the lofty valuations, with potential for a market correction, and also have a fear of missing out on further gains. In this letter, we outline how Equitas is approaching the market.

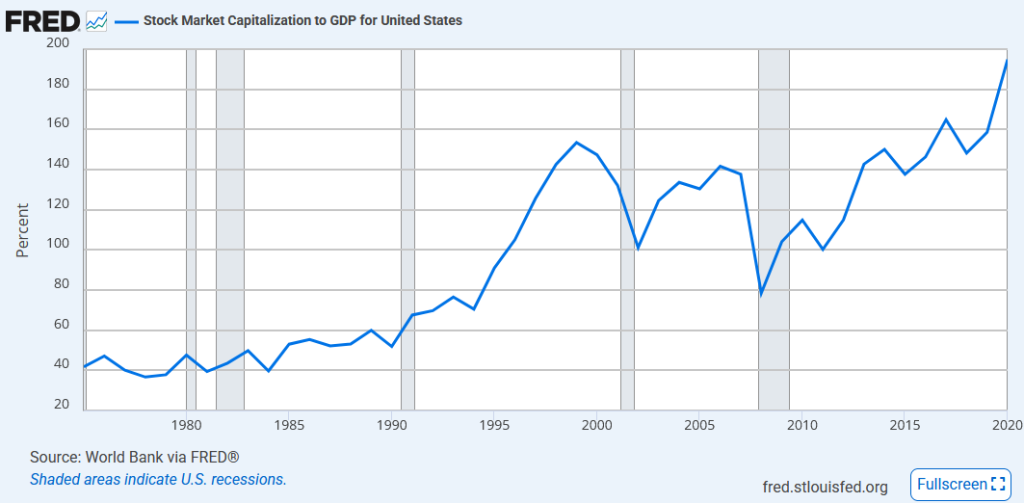
Total stock market valuation as a percentage of GDP (the Buffett Indicator)

Several important measures show stocks are incredibly expensive relative to past earnings. The Buffett Indicator has reached an unprecedented 217–218% of GDP, above the 200% level where Warren Buffett is quoted as saying investors are “playing with fire.” This is even higher than the dot-com bubble peak of 160% in 2000. The Shiller P/E ratio sits at 39.8 — the second-highest reading in over 140 years. The S&P 500 trades at a forward P/E ratio of 22.5–23.6, much higher than the normal range of 16–17. Even more alarming, the trailing P/E recently crossed 30. This has only happened once before since the 1800s, during the dot-com bubble of 1998–2002. After that bubble burst, it took seven years for markets to recover.

Goldman Sachs projects modest 3% annual returns for stocks over the next decade. They say there’s a 72% probability that stocks will underperform bonds through 2034. Even JPMorgan projects a return only slightly higher than 6%. This sobering forecast comes directly from today’s elevated valuations. Sentiment across institutional investors remains skittish, with 58% of the Bank of America Global Fund Manager Survey deeming markets “overvalued.”

Despite these extreme valuations, the economy shows remarkable strength. The unemployment rate holds steady at 4.3% as of August 2025, with 7.2 million job openings available. Consumer spending remains robust, with retail sales rising 0.6% in August and up 5% for the year. Workers are seeing wage growth of 3.7% annually, giving them real purchasing power. Credit markets also show resilience — credit card delinquencies remain near historic lows at 3.05%, well below the long-term average of 3.71%. This healthy credit environment supports continued consumer spending while reducing financial risk. Most of these figures are tracked on our Economy Monitor page.

Corporate America continues delivering impressive results. S&P 500 companies posted 11.8% earnings growth in Q2 2025 — the fifth consecutive quarter with profit margins exceeding 12%. Even better, 81% of companies beat earnings estimates. Corporate balance sheets remain fortress-like, enabling record-breaking buyback programs exceeding $1 trillion through August 2025.

S&P 500 concentration among the top 10 constituent companies

Several structural changes help support these elevated valuations. The number of publicly traded companies has declined significantly. This creates concentration effects, with the top 10 S&P 500 stocks making up nearly 40% of the index. These mega-cap companies — like Nvidia (7.2% weight), Microsoft (6.3%), and Apple (5.9%) — are highly profitable, driving both growth and expectations higher.

Opportunities

As we wrote last quarter in “Dividend Aristocrats,” dividend investing maintains defensive appeal during recessionary periods. During the worst modern period for dividends, the 2008 financial crisis, S&P 500 dividends declined just 23% while stock prices fell over 50%. The average cut in a bear market is just 2%. This income resilience provides behavioral advantages, reducing the temptation to time markets. Further, firms like Goldman Sachs forecast 6% dividend growth in 2025, rising to 8% in 2026. Tax advantages enhance dividend strategies’ appeal — qualified dividends face maximum federal tax rates of just 20% for high earners, compared to ordinary income rates up to 37%. Since 1960, reinvested dividends account for 85% of the S&P 500’s total return, demonstrating the power of compounding income.

Energy sector valuation relative to the broader S&P 500

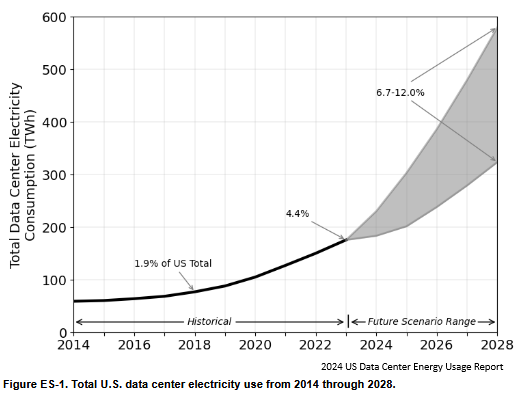
While broad market valuations appear stretched, compelling opportunities exist in overlooked sectors. The energy sector trades at a P/E ratio of 17, representing a 30% discount to the S&P 500’s multiple of 24. Morgan Stanley, Berkeley, MIT, and Chevron have all predicted that projected power demand for AI will primarily be met with natural gas. LNG exports are projected to double by 2028.

Master Limited Partnerships — the pipelines that move this gas from the well to the market — offer another pocket of value, combining attractive yields averaging 5% with tax advantages. These equities currently trade at P/Es near 15, and can be combined with call writing to further increase the yield.

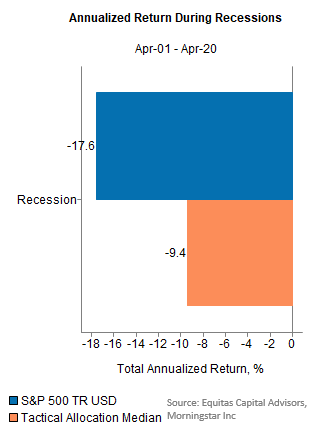
In environments of extreme valuations, tactical asset allocation strategies demonstrate their value through active risk management. Our own research on recessions from the past three decades indicates that the median tactical fund has roughly half the downside of the S&P 500. However, most of the tactical industry is just as good at protecting from the upside as they are the downside — when looking in this area, be sure to find a fund that can excel in both bull and bear markets. Our own Navigator strategy exemplifies modern tactical allocation. We combine both fundamental data on the real economy with pure technical measures regarding market prices. This approach enables monthly rebalancing between aggressive growth positioning and defensive cash allocations based on market conditions.

Tactical allocation performance during historical market drawdowns

The current market environment presents unprecedented challenges, with valuations at historic extremes. The Buffett Indicator’s record reading of 217% and the Shiller P/E approaching 40 signal clear warning signs that cannot be ignored. Yet several factors differentiate today’s market from previous bubble periods. Corporate fundamentals remain strong with double-digit earnings growth. The labor market shows resilience. Credit quality remains healthy, and consumer spending continues expanding. Investment opportunities exist for those willing to search beyond the overvalued mega-caps — energy sector valuations offer compelling opportunities, Master Limited Partnerships provide attractive tax-advantaged income, tactical asset allocation strategies offer crucial risk management tools, and dividend strategies provide portfolio ballast through steady income generation. The current environment demands careful portfolio construction, balancing participation in continued market strength with protection against inevitable corrections.

Dividend Aristocrats: Building Generational Wealth

The Ultimate Guide to Building Generational Wealth

Do you know the only thing that gives me pleasure? It’s to see my dividends coming in.John D. Rockefeller

While our interests are more varied than Mr. Rockefeller’s, dividend investing remains a focus at Equitas. Our 2012 article, “An Interest in Dividends,” sparked the idea that launched our own dividend strategy, tailored for income-focused clients like retirees.

Benefits of Dividend Investing in a Volatile Market

Dividend stock investing is a time-tested strategy that appeals to a broad range of investors, from retirees seeking reliable income to long-term investors focused on compounding wealth. At its core, this approach involves owning shares of companies that return a portion of their profits to shareholders in the form of regular cash payments — known as dividends.

What makes dividend strategies so compelling to clients is the sense of stability and predictability they offer. Unlike growth stocks, which rely heavily on market appreciation and can be volatile, dividend-paying companies are often mature, financially sound businesses with a history of strong earnings. These regular payouts provide investors with tangible income, often on a quarterly basis, that can either be used to meet expenses or reinvested to accelerate growth. This consistent stream of income becomes especially valuable during periods of market turbulence, when price appreciation may be harder to come by.

For example, during the 2008 financial crisis, the Dividend Index declined 35%, compared to losses of 47% for the Value Index and 45% for the Growth Index. Income from dividend-paying stocks held up even better, falling just 23%, and that was the worst year for dividend stocks. The financial origin of the crisis impacted bank earnings, which typically form a large portion of the big dividend payers. A broader study by Moon Capital further supports this point: even accounting for the 23% decline in dividends during the financial crisis, the average dividend cut during bear markets is just 2%.

Furthermore, dividend investing offers several tax advantages that can enhance an investor’s overall returns. In the United States, qualified dividends are taxed at a lower rate than ordinary income, while ordinary (non-qualified) dividends are taxed as ordinary income, at rates up to 37%. Under current U.S. tax law, qualified dividends enjoy more favorable rates:

  • 0% for taxpayers in the lowest brackets
  • 15% for middle-income earners
  • 20% for high-income individuals
  • A possible additional 3.8% surtax (NIIT) may apply to high earners

Additionally, dividends received in tax-advantaged accounts like IRAs or 401(k)s can grow tax-free or tax-deferred, allowing investors to compound their returns without immediate tax liabilities. Advisors, working with their clients’ accountants, can help investors offset dividend income with capital losses or deductions.

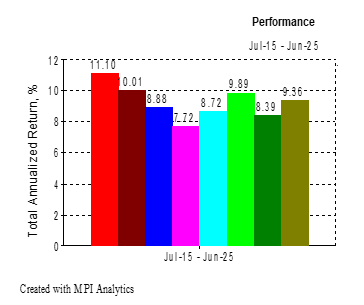
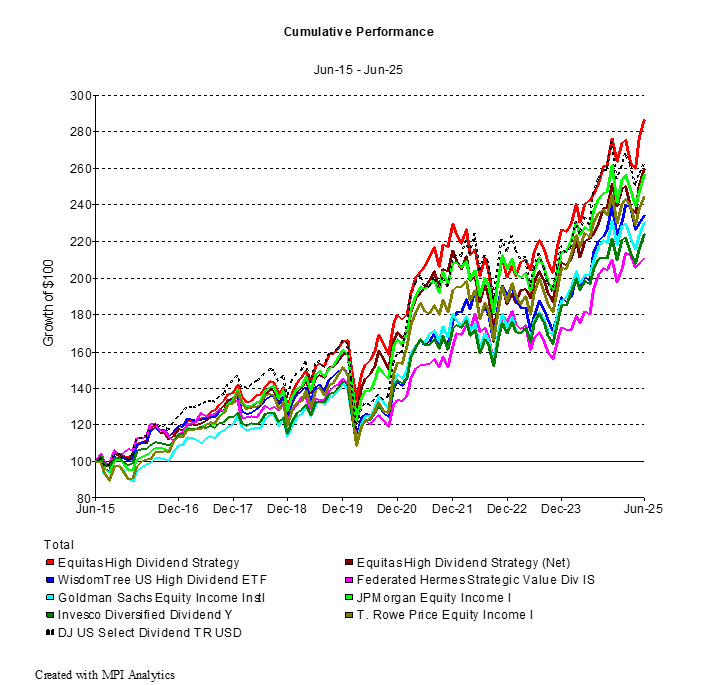
Recently, the Equitas High Dividend Strategy celebrated its 10-year anniversary. Over the past decade, Equitas Capital Advisors has delivered strong results through our deep experience in dividend investing. As of June 30, 2025, our Equitas High Dividend Strategy gained 8.8% (8.3% net) for the first half of the year and 18.1% (16.9% net) over the past 12 months, compared to 3.2% and 14.5% for the dividend index. These returns not only outperformed the style-specific Dow Jones Select Dividend Index but also exceeded the performance of almost all major domestic equity indices during this volatile economic environment. In addition to these strong total returns, the strategy is currently delivering a 4.4% dividend yield with consistent monthly income.

Our 10-Year Record with Dividend Investing

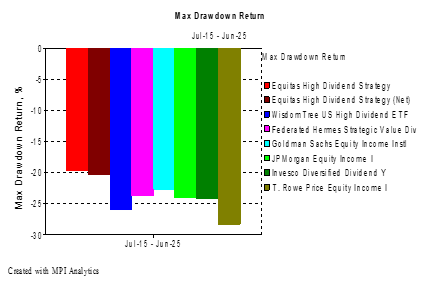
At Equitas, we approach dividend investing with a more balanced strategy — one that not only generates income and provides resilience during down markets, but also retains the ability to participate in up markets. The result is a strong, long-term performance record over the past 10 years: higher yield, smaller drawdowns, and superior returns compared to other dividend funds.

Below are select tables and graphs from our recent dividend manager search. The full report is available for free upon request.

Equitas High Dividend Strategy performance versus dividend index

*Net performance includes a max 1% fee.

Dividend strategy drawdown comparison
Dividend strategy yield comparison
Dividend strategy long-term return comparison

Equitas Capital’s proprietary Dividend Equity Strategy employs a hybrid approach. We blend both high-dividend-yield stocks for immediate income (examples include AT&T, Welltower, and Altria) and dividend-growth stocks for long-term appreciation (examples include Microsoft, IBM, and JPMorgan Chase) to create a balanced portfolio that delivers both current income and future growth potential. The strategy utilizes a research-driven selection process with over 20 sector-specific metrics across five key dimensions — valuation, financial health, profitability, dividend consistency, and technical trends — to identify quality companies with sustainable dividends while avoiding yield traps. With thoughtful diversification across 40+ stocks spanning all 11 major S&P sectors, the portfolio is designed to provide durable income, steady capital appreciation, and enhanced risk-adjusted returns without over-concentration in any single industry. Please contact us for more information on our High Dividend Strategy and the companies we invest in.

Tariff Tantrum 2.0

In our last report, “Why Smart Investors Must Watch for an AI Bubble Now,” Equitas warned about high valuations in Large Cap Growth stocks. U.S. stocks, led by high-tech growth, began to drop in mid-February after a steady start to the year. While we predicted volatility ahead, the market showed us sooner rather than later.

The drop was triggered by new tariffs, which are taxes on goods imported from other countries. In early 2025, President Donald Trump proposed increasing tariffs, especially on cars. This worried investors because higher costs could reduce company profits and slow economic growth. In March alone, the S&P 500, a key measure of U.S. stocks, fell about 6%. Technology companies like Nvidia and Tesla saw larger declines, some exceeding 20% down from their peak.

While further tariff increases will have an impact on American businesses, some argue that the market reaction has been worse than the actual predicted impact on earnings. More than anything else, markets hate uncertainty. In its essence, a stock is a claim on all of the future earnings of a company. A short-term impact can be modeled and discounted. When no one is sure what will happen or how long it will go on, potential outcomes — especially on the downside — must necessarily increase in scope as well.

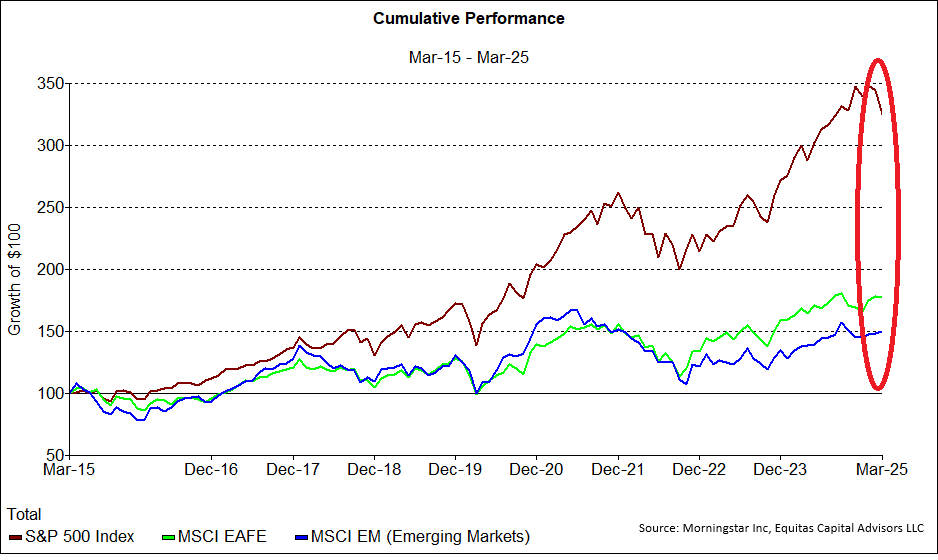
While U.S. stocks struggled, down 4% for the quarter, investments in international and emerging markets produced gains. International markets include countries like those in Europe and Japan, while emerging markets refers to China combined with nations like Brazil and India, which are still developing rapidly. The recent out-performance is just that — recent. It is uncharacteristic in a long period of U.S. out-performance.

U.S. versus international and emerging market equity performance

Europe’s stock markets ended the first quarter up 7%, their best start to a year since 1998, partly from increased defense spending which boosted their economies. In China, stocks rose due to growth in technology sectors like artificial intelligence combined with ongoing stimulus measures. While how long this trend lasts remains an open question, the reality is that thus far, the better return from non-U.S. investment is too brief to describe as the start of a new trend.

S&P 500 versus international equity performance during the tariff sell-off

Turbulent times like now, or especially 2022, can fill the most intelligent of investors with fear. The temptation to run to the safety of cash is tempting, and the fear of further loss can cause paralysis, preventing appropriate return to the market. Consider the stories of Michael and Henry, two investors who faced the same market conditions but made very different choices.

Michael, a successful business owner in his 50s, came to us in mid-2022 when markets were down significantly. Despite anxiety about the markets and his eventual retirement, he trusted our guidance for a diversified portfolio that balanced risk management with growth. The first few months were uncomfortable as volatility continued, but Michael maintained his discipline. By early 2023, his portfolio began to recover, and today, his investment has grown substantially.

Henry’s story took a different turn. When the market declined in 2022, he liquidated his investment portfolio. The immediate relief he felt from stopping the losses soon gave way to a new concern: when to get back in. As markets began to recover in late 2022 and early 2023, Henry remained convinced that another drop was imminent. He waited for the “perfect time” to reinvest, but that moment never seemed to arrive. Each market uptick made him more reluctant to buy in at “higher prices,” while every small correction reinforced his fear that worse declines were ahead. Today, Henry’s family investments remain in cash, earning minimal interest that hasn’t kept pace with inflation, effectively reducing his purchasing power. Worse, he’s watched from the sidelines as the market has delivered substantial returns to his coworkers who stayed invested. Meanwhile, Michael just called our office asking if the tariff sell-off was a good opportunity to rebalance into the market and buy growth while it’s on sale.

These contrasting experiences highlight a fundamental truth about investing: timing the market consistently is nearly impossible, even for professionals. The cost of missing just a few of the market’s best days can dramatically impact long-term returns. Michael’s willingness to embrace discomfort and invest during weakness — with professional guidance — rewarded him with significant growth. Henry’s decision to seek safety, while understandable, ultimately cost him the opportunity to retire earlier.

Why Smart Investors Must Watch for an AI Bubble

Heading into the end of the year, the investment market has given us and our clients plenty to be thankful for. Even so, more than one client contacted us recently with thanks, but also a request. Despite beating their benchmarks for 2024, these clients wanted more. Each client initially asked for a balanced portfolio focused on downside protection (and sometimes a yield target). Then, the blazing S&P 500 stock index ended September up 36% for the past 12 months. While this index has more volatility and downside than their benchmark, the pull to chase what’s already run can be a powerful influence — even on seasoned professionals.

US Large Cap Growth investments have broken almost every rule from traditional investment advice. The truth is Large Cap Growth stocks, represented by either the Nasdaq or the Russell 1000 Growth index, have smashed all expectations by returning an annualized 16% over the past decade. This growth, in large part driven by tech and the continuing AI revolution, has surprised value investors and professional giants like JPMorgan, who continue to project only 7% annualized gains for US large cap stock. There is no reason to expect mean reversion at any point in time, and being early can be indistinguishable from being wrong.

Transformative technologies often follow a predictable pattern: innovation, adoption, euphoria into a bubble, and eventually, correction. The railroad boom of the 1840s, the internet revolution of the 1990s, and even the smartphone era of the 2010s all demonstrated this cycle. The Dot Com bubble of 2000 took 5 years to build, 1 year to burst, and anywhere from 7 years (S&P) to 15 years (Nasdaq) to get back to even. Getting caught on the wrong side of a bubble can be incredibly punishing.

Nasdaq forward price-to-earnings ratio versus historical average

The Nasdaq index forward price-to-earnings ratio (P/E) hovers near 27, down from the peaks of the dot-com era, but still elevated compared to longer-term historical averages near 20. Investors placed $26B into the Nasdaq ETF (QQQ) in 2024 alone, with over a hundred ETFs focused on AI, cryptocurrency, and hyper-growth stocks representing billions more. Many of these funds launched within the last year. Some of the highly valued and highly volatile stocks include Gilead Sciences (GILD) and Palantir (PLTR), with P/E ratios above 500.

At Equitas, we’ve developed comprehensive frameworks for evaluating AI investments beyond the headlines. Our Navigator system incorporates both technical and fundamental factors to automatically reposition clients between high-risk growth investments and safety. While we expect significant volatility ahead, the underlying trend remains one of the most powerful in market history. As of today, the momentum continues and could even increase. Bubbles tend to get frothy before they burst. The key to successful navigation will be maintaining exposure while building in safeguards against inevitable market excesses. Please contact us to learn more about our systematic approach to managing technology exposure.

Fed Rate Cuts: Will Your Portfolio Boom or Bust

In September 2024, Jerome Powell announced the first Federal Funds Rate cut in over four years. The Federal Funds Rate is a short-term rate related to the cost of debt in the American economy. Some expected the Federal Reserve to cut only 25 basis points, but they delivered a 50 basis point cut. Powell explained this as a result of data that had grown unexpectedly worse since the Fed’s last meeting. We think they are also being a bit more proactive than they have in the past, which is a good sign.

August’s inflation reading (released September 27th) confirmed the softening trend, seeming to emphasize the appropriateness of the Federal Reserve’s double cut, and possibly signaling more ahead for this year as the Fed becomes less concerned with inflation. With the neutral rate nearing 2%, they have plenty of room.

In recent history, both the 2000 Dot Com crash and the 2007 Financial Crisis rate cutting cycles started with a 50bps cut. These cuts, delivered after major negative impacts, foretold ominous future developments. We’ve also had one of the longest periods with an inverted yield curve, which is another negative indicator when short-term interest rates are higher than rates for bonds with maturities further in the future. Similarly, the “Sahm Rule,” named after a former Fed economist, just turned negative. This indicator predicts recession whenever unemployment increases half a percent within a year. Despite that, even Claudia Sahm herself states that her rule is “too simple for the complicated economic situation the U.S. is in right now.” Still, she urges vigilance.

The metrics we track on our Economy Monitor page show consumer debt, unemployment, and other measures normalizing from historic lows after all the government stimulus spending in the wake of COVID. These signs seem to confirm Sahm’s augury that the economy remains healthy.

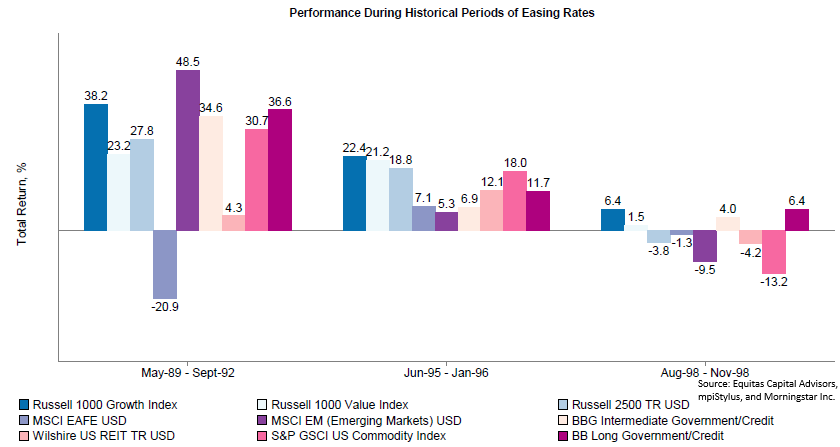
Given that rates are coming down and it’s reasonable to expect growth to remain adequate, what does that mean for your investments? To study this, Equitas had to look further back for rate cuts that happened without negative economic shocks. From 1990–2000, there was a single recession, related to the 1990 oil price shock. However, there were three other instances of falling Fed Funds Rates. We can closely examine these periods in order to identify potential trends, or a lack of a trend.

Stress test of asset classes across historical Fed rate-cutting cycles

In these particular periods, Large Cap Growth (represented by the Russell 1000 Growth) performed particularly well. Interestingly, so did the Long Government/Credit Bond index. Both of these investments are considered to pay off more into the future than today, with lower rates increasing the value of those future payoffs. Alternatively, Emerging Market Equities — represented by the MSCI EM index — had the greatest variability, doing best in the 1989–92 cycle but falling to second-to-last in the ’98 easing cycle. International markets seem similarly uninspiring.

In review, this is a time to remain vigilant. As history shows, sometimes the only difference between a healthy economy and the brink of recession is avoiding an unexpected shock that impacts the global economy. With open hostilities overseas and labor disputes at home, a prudent investor can find plenty to worry about. While allocations based on 20-year long assumptions can get rocked in the short term, more frequent positioning has the potential to keep your portfolio closer to where the market is moving.

As always, Equitas is continuing to monitor leading economic indicators, technical indicators, and global developments on behalf of our clients. Please don’t hesitate to reach out if you have any questions or would like to discuss how these developments impact your specific financial situation.

Mastering Fear and Greed

Warren Buffett once highlighted a peculiar characteristic of human nature:

“Pension Funds in 1970 put 100% of new money into stocks because they were wild about stock. Then stocks got a lot cheaper in 1978 and they put a record low of 9% of new money into stocks. People behave very peculiarly in terms of their reactions because they are human beings. They get excited when others are excited. They get greedy when others are greedy. They get fearful when others are fearful, and will continue to do so. You will see things you will not believe in your lifetime in the securities market. The country will do very well over time, but you will see these huge waves. If you can stay objective and detach yourself temporarily from the crowd, you can get very rich.”
Warren Buffett

Newton’s first law of motion states that an object in motion will remain in motion unless acted upon by an outside force. This tendency to resist changes in motion is known as inertia. This concept also applies to the patterns of human behavior when investing. When stock prices decline, stress levels rise, increasing the emotional urge to sell. Conversely, as investment values increase, so does euphoria, strengthening the desire to buy. This leads to the common tendency to buy high and sell low, the opposite of successful investing.

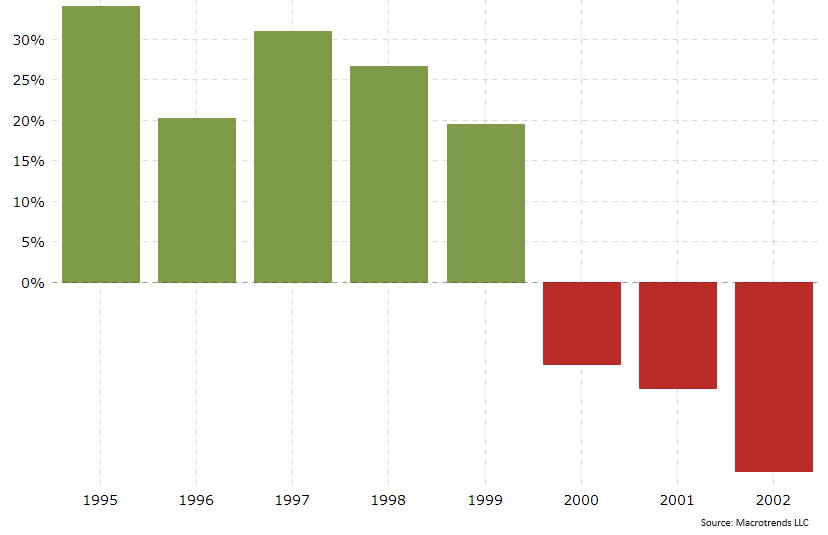
Let’s examine a historical scenario for more context. Below is a graph of the S&P 500 from 1995 to 2002. From the beginning of 1995 to the beginning of 2000 the index price increased from about 20% to 35% each year. Every year it felt like the market moved from fairly valued, to overvalued, to highly valued, to irrational exuberance. Selling in the early years would have missed the full increase and been judged poorly. However, going into the year 2000, the momentum shifted. Right then, a sale was the best option before the S&P 500 lost half its value, and the NASDAQ lost 80%, by 2002.

This is a good example of a technical market correction. Did the companies of the S&P 500 lose half their intrinsic value in 2002? No. Were the companies worth the high price set in 1999? Again, the answer is no. The market overshoots in wide swings above and below its fundamental value. These are the technical swings of the market caused by human behavior. Over the short term, these technical swings are as powerful for stocks as duration is for bonds. No one can predict or time these market shifts, but market sentiment and momentum can be tracked, measured, and analyzed.

S&P 500 annual returns by year

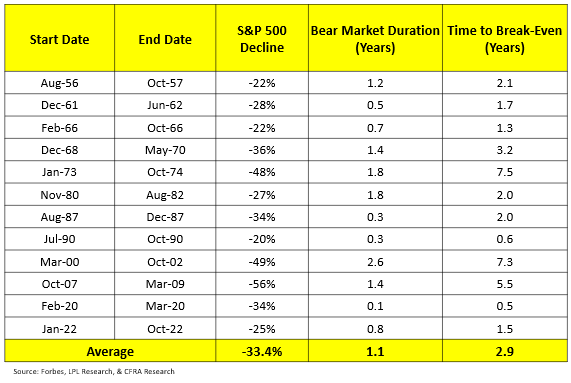
The table below shows all the S&P 500 bear markets since inception of the index. The average loss is over 33%, the average bear market duration is over a year, and the time to break-even is just under 3 years! Sometimes it is as long as 7 years.

Table of S&P 500 bear markets since inception

So, when should stocks be sold, and when should the winners be allowed to run? As we discussed in our April 2024 bond seminar, despite 8.5% bond yields, equity market prices have increased from high to even higher. Rebalancing out of growth early would have been a mistake.

Many investors cannot handle the downturns and delays of these market cycles. Many non-profit institutions, like University Endowments or other Foundations for example, need cash flow for their mandatory spending every semester. Retired individuals need regular cash flow for living expenses. By analyzing the technical indicators, some risk management can be brought in that does not exist with purely fundamental analysis of index funds. Passive index funds are built on the fundamental size of the stocks in the index, and must remain fully invested at all times due to their prospectus. By combining technical and fundamental research, we find risk management characteristics that are otherwise absent in index funds.

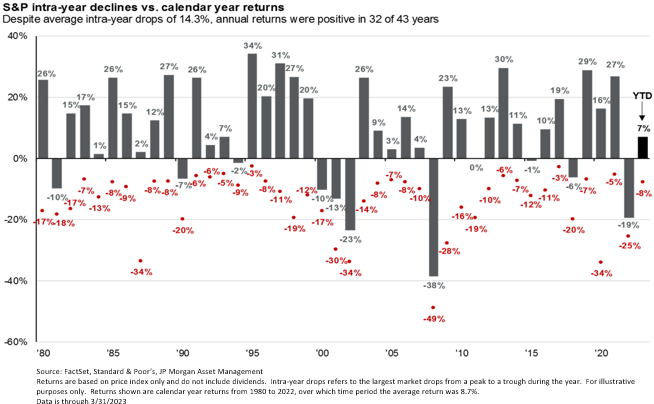
Embedded in each year’s stock market return is a drawdown. The “average investor” tends to get uncomfortable and can sell at these bottoms. Risk management is needed to protect against this emotional human behavior.

Intra-year drawdowns for the S&P 500

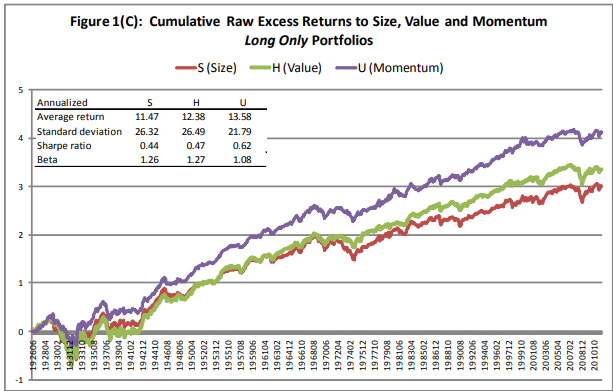
Momentum and technical analysis has been well-studied, with many papers indicating a significant market edge. In 2012, researchers Ronen Israel and Tobias Moskowitz demonstrated that Momentum has historically outperformed both Size and Value factor investing from Fama French:

Israel and Moskowitz 2012 study comparing Momentum, Size, and Value factors

Several professional research companies have performed similar and expanded studies with published calls going back decades. After our in-depth review of their work, Equitas now works directly with these researchers. This dimension of analysis is currently at work for many of our client portfolios. We welcome you to contact us today to learn how these tools can serve a valuable function in your portfolio.

Warren Buffett trained himself to not be worried about the wide market swings of his stock portfolio and looked beyond the market value to the value of the underlying businesses. This worked very well for him; however, the volatility of those market swings caused him to lose half his net worth 5 times in his career! 3 of those were with Berkshire Hathaway stock. Mr. Buffett is the only man I ever met who can take that kind of risk without becoming very emotional and irrational. For the rest of us, we need the safety and risk management of technical analysis.

A Reverse Mortgage on America

In 2010 we published a KnowRisk Commentary with a greatly simplified description of the US budget called Federal Budget 101. Since the same issue has not only remained, but unfortunately grown in size, we thought it timely to revisit the Jones family and see how they are progressing in a new article called A Reverse Mortgage on the Country.

Years ago, I published this analysis of the government debt and deficit. The numbers are so large, in order to make it more understandable I knocked off 8 digits to create the parallel to a family household called the “Jones family”. Apparently, no one from the government read the publication because the Jones family scenario has grown worse. Today we will update the numbers. Let’s put the federal budget into perspective. The 2023 fiscal year Federal Budget analyzed in simple terms:

  • U.S. Income: $4,440,000,000,000i
  • Federal Budget: $6,130,000,000,000i
  • New Debt: $1,700,000,000,000i
  • National Debt: $33,170,000,000,000i
  • Deficit Spending: 27.7% (% of all Spending)

It helps to think about these numbers in terms that we can relate to. Let’s remove eight zeros from these numbers and pretend this is the household budget for the fictitious Jones family.

  • Annual Income: $44,400
  • Expenses: $61,300
  • New Debt: $16,900
  • Credit Card Debt: $331,700
  • New Debt/Expenses: 27.6%

At the end of the 2023 fiscal year, the federal government had an average interest rate of 2.97%.ii This number is increasing rapidly with the interest rate from a 1-month T-Bill at 5.355% as of this letter.iii If all of our debt had this interest rate, our annual interest payments would be 40% of our yearly revenue. This is, still, substantially lower than what the Jones family would pay thanks to interest on Federal Debt being much lower than most individuals’ debt. As of November 2023, the average APR for an individual’s debt is 22.75%.iv This would amount to $75,462 a year in interest payments for the Jones family. That’s 170% of their annual income! If they used all of their income to pay off their interest, they’d still have $31,062 left in annual debt payments. They wouldn’t have any money for basic living expenses such as for groceries, rent, utilities, etc.

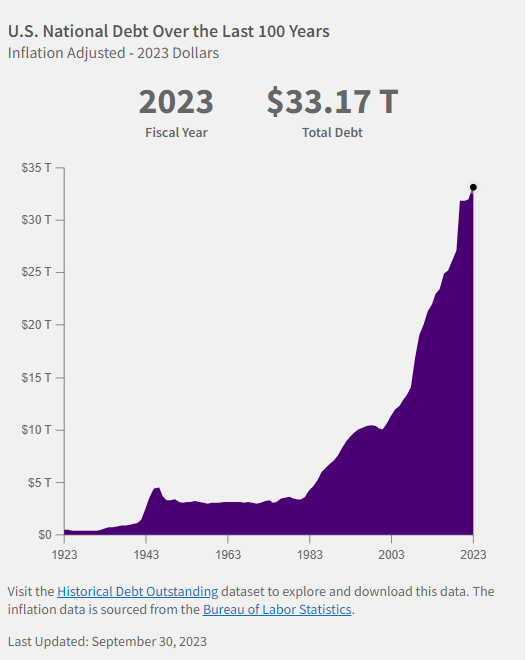
In 1945, just after World War II, the Jones family’s debt stood at $43,800.i At the end of 1983, their debt was $42,000.i In 38 years, their debt actually fell $1,800. The Jones family practiced fiscal responsibility and demonstrated their ability to run a surplus. In the next 38 years, their debt rose $275,900.i Their debt’s exponential growth is a ticking time bomb.

Currently, the market is anticipating a soft landing with lower interest rates. If this is incorrect, it would only exasperate the fiscal burden. The higher the interest rates, the more costly the debt.

One option to combat this debt is inflation. This is an option for the government, but this is not an option for the Jones family. The debt is denominated in US dollars, and if the dollar lessens in value, so does the debt. Unfortunately, this would erode the purchasing power of consumers and corporations and pose challenges to economic stability and growth.

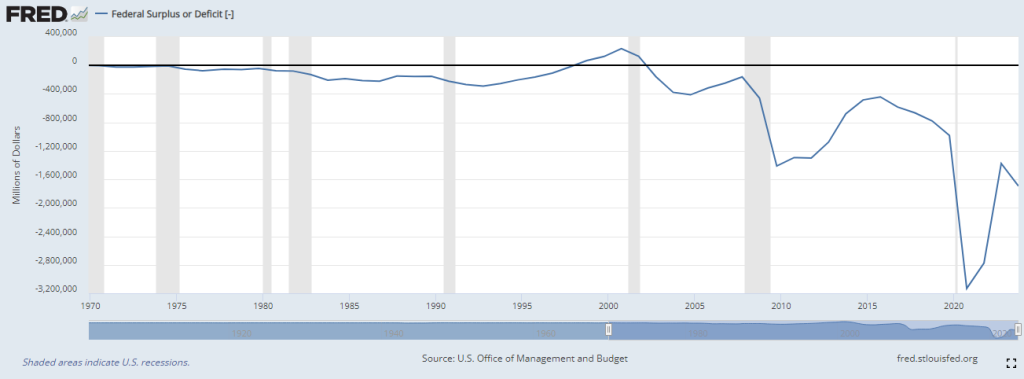
Now after years of irresponsible decisions, the Jones family has $331,700 of debt on its credit card (which is the equivalent of the national debt). That’s 7.47 years of their annual income, and they continue to add to their debt year after year. They haven’t had a surplus since 2001. Since that time, their debt skyrocketed by $231,800.i That is almost 70% of their total debt! One would think the Jones family would recognize and address this situation, but they do not. Neither does Congress.

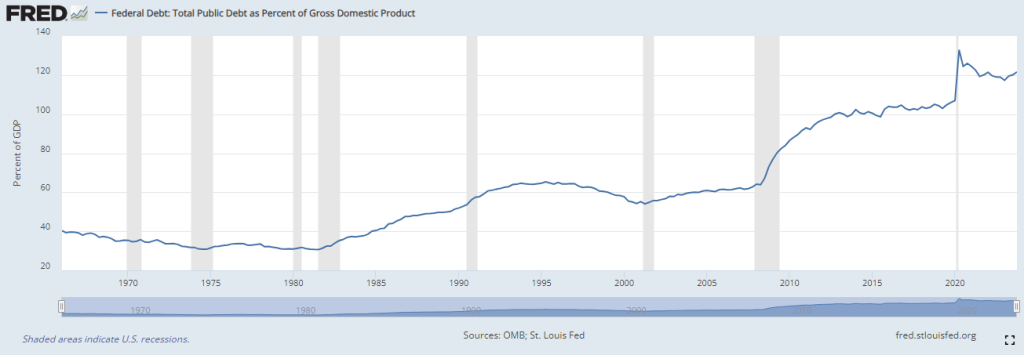
Essentially, what we have is a reverse mortgage on the country, a practice where we draw upon future resources to meet present demands. To date, total Debt-to-GDP has reached 120%. This is important to note, especially in light of a 2010 World Bank study that suggested a ratio greater than 77% had a negative impact on real growth levels. Another study from Penn-Wharton Budget Model suggests that 200% would be a maximum limit for U.S. debt held by the public.

Lower interest rates will help narrow the deficit, but more work is needed if Congress hopes to normalize our debt levels. A reduction in Federal spending, or an increase in revenue (taxes) has the potential for a cooling effect on both the economy and inflation. Under an ideal scenario, the deficit shrinks together with inflation and interest rates, bringing us into a smooth landing. Equitas Capital Advisors is watching for any unexpected developments, and ready to react if necessary.

2023 Investment Review: Magnificent Seven Lead

Defying widespread recession predictions, the S&P 500 stock market index soared an impressive 26% in 2023. As Warren Buffet says, “never bet against America.” That large headline number obscures the narrowness of a market lead by “the Magnificent Seven” (Nvidia, Tesla, Apple, Microsoft, Amazon, Meta/Facebook, and Alphabet/Google). These tech, AI-related companies’ stock prices appreciated an unprecedented average of 111% last year. The Magnificent Seven grew to the largest concentration the S&P 500 has ever had, 29%. The Equal Weight Index only earned 12%. Without the Magnificent Seven, the index would have risen only 8%.

The dominance of these mega-cap firms in technology set a tough stage for diversified strategies. Typically, the largest companies are not always the best companies, and active managers diversify their holdings in attempt to reduce risk. For many, this means including less correlated and historically higher returning asset classes like small cap or overseas equities. In years with large concentrated positive performance, diversification can act as a drag on the portfolio. The Small Cap Russell 2000 returned +17% for 2023, while the overseas MSCI EAFE returned +19%. These returns, typically considered great, lagged behind the concentrated S&P 500. Within Large Cap Equity alone, the S&P 500 ETF index fund “SPY” outperformed the median active manager by the largest amount in two decades.

The Physics of Investing

Sir Isaac Newton introduced the three laws of motion in 1687. Newton’s First Law of Motion states that an object in motion tends to stay in motion unless an external force acts upon it. Drawing parallels with Newton’s laws, momentum is also a potent force in the stock market. An old Wall Street saying paraphrases: “A market in motion tends to stay in motion, until it stops.” Technical analysis is the discipline that tracks these changes in momentum. Traditional investing relies on mean reversion, or the assumption that investments are cyclical and return to the mean. The past year, and the past decade even, seems to have been more technical and momentum based. Looking to the future, estimates from Bloomberg and others predict AI spending to increase between 20-40% a year. Given such, technical factors have strong potential to continue influencing market returns. Equitas Capital Advisors has worked to fuse economic indicators from Ned Davis with technical indicators from Dorsey Wright. This work, expressed by our Navigator series of investments, had its inaugural year in 2023. Please contact us to learn more about our Navigator system available for balanced portfolios, stock only and bond only formats.

Value Hunting

Separate from tech-related growth stocks, value stocks also maintained their momentum of relative underperformance. A retracement of commodity prices, especially the price of oil, has helped inflation normalize to historical levels. Increasing US production, as well as political allowances given to Venezuela and Iran, helped push energy prices down. Energy and mineral equities remain out of favor given the sale price of their outputs, and the market continues to price their stocks at a discount as a result.

Value and commodity equities relative to the broader market

Home Country Bias

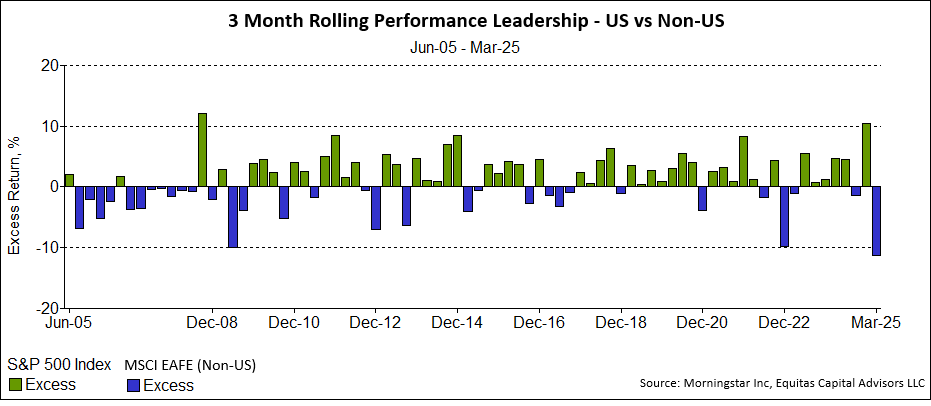
Given the outperformance of US large cap, both international and other diversified investments created a drag on performance that has lasted about a decade. A longer-term view will show that these categories exhibit more dynamic changes in leadership, roughly divided by decade.

Decade-by-decade leadership shifts between US and international equities

The green bars represent US domestic outperformance, while the blue bars represent International Equities outperforming US stocks. This extremely complex relationship depends on hundreds of factors from currency strength, interest rates, commodity prices, and even wars. The recent AI Tech trend driven by US mega caps has extended the current US dominant cycle. Faster growing economies overseas, changes in both commodity prices and interest rates, and ultimately the strength or weakness of the US Dollar can potentially be an “outside force” that can act on the motion of domestic stock market dominance.

Every quarter, the Federal Reserve releases projections on where they believe interest rates will be in the near future. US rates falling faster than international can provide a bonus to non-dollar denominated investment earnings. Most Federal Open Market Committee members see rates falling, yet remaining near 3%, much higher than the previous average. The Federal Funds Rate, from the beginning of 2008 through the end of 2022, averaged less than 1%. A higher cost of capital will marginally benefit mature and cash flowing companies while putting companies that require large investments to develop new projects, or fund their existing operations, at a relative disadvantage.

Federal Reserve dot-plot interest rate projections

To keep closer watch on current economic data, Equitas is proud to launch a new “Research” section of our website at equitas.capital/research, or accessed under the dropdown menu for “NEWS.”

Equitas Research dashboard preview

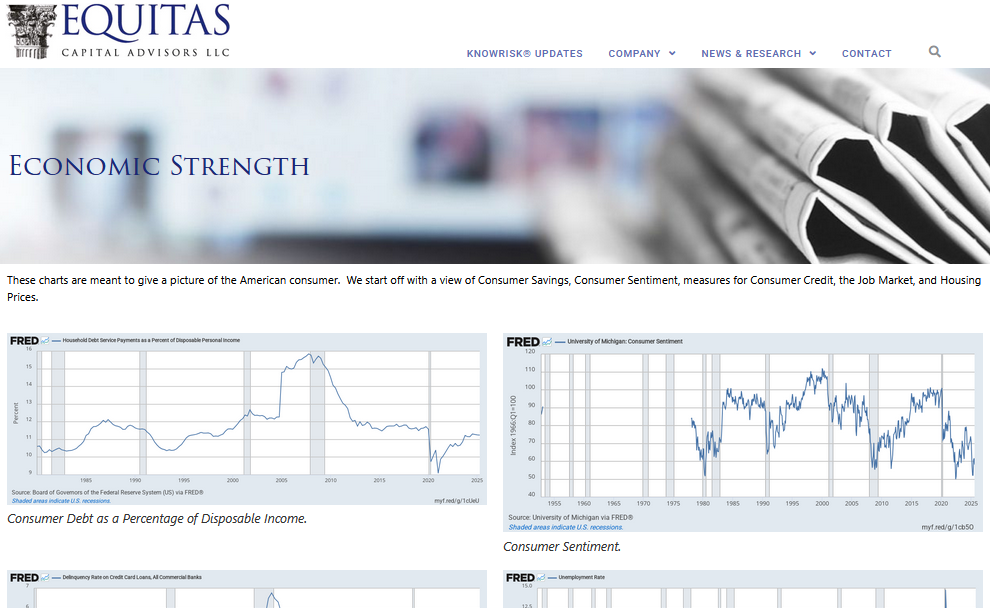
This repository of charts is directly from official sources, and will automatically update on a regular basis. Our first series is on the economic strength of America, of which the consumer comprises roughly 70% of our GDP. From these published charts, the consumer balance sheet and levels of employment remain at historic healthy levels. Noticeably, mortgage rates recently peaked after their highest, sharpest rise in decades. This factor has likely pressured the still normal but quickly changing metrics of rising credit card delinquency and depleting personal savings. This is an active area for us with more dashboards on the way. Please contact us to learn more about our expertise, and if your portfolio is best positioned for your goals and risk tolerance.

Consumer balance sheet and employment metrics dashboard

Economic Strength

Economic Strength

These charts are meant to give a picture of the American consumer.  We start off with a view of Consumer Savings, Consumer Sentiment, measures for Consumer Credit, the Job Market, and Housing Prices.

alt=”FRED Chart 3″>
Consumer Debt as a Percentage of Disposable Income.
FRED Chart 8
Consumer Sentiment.
FRED Chart
Credit Card Deliquency.
FRED Chart 2
The Classic Unemployment rate.
FRED Chart 7
Personal Saving Including Consumer Durables.
FRED Chart 4
4-Week Moving Average of Initial Jobless Claims.
FRED Chart 5
30 Year Fixed Rate Mortgage Average in the United States.
FRED Chart 6
Labor Force Participation Rate.

In 2002, Equitas Capital Advisors, LLC was established as a unique company that blends the resources of a large global corporation with the flexibility of a small boutique firm. The registered service mark of Equitas Capital Advisors is Engineering Financial Solutions®and the purpose of Equitas is to design, build, and deliver investment solutions to meet the goals and objectives of our investors. Equitas Capital Advisors, LLC located in New Orleans, has over 200 years of combined investment management consulting experience providing professional investment management services to investors such as foundations, endowments, insurance companies, oil companies, universities, corporate retirement plans, and high net worth family offices.

Disclosures and Disclaimers:

Above information is for educational purposes only and has been obtained from reliable sources but no guarantee is made with regard to accuracy or completeness. It is not an offer to sell or solicitation to buy any security. The specific securities used are for illustrative purposes only and not a recommendation or solicitation to purchase or sell any individual security.

Equitas Capital Advisors, LLC is registered as an investment advisor with the U.S. Securities and Exchange Commission (“SEC”) and only transacts business in states where it is properly registered, or is excluded or exempted from registration requirements. SEC registration does not constitute an endorsement of the firm by the Commission nor does it indicate that the advisor has attained a particular level of skill or ability.

Information presented is believed to be factual and up-to-date, but we do not guarantee its accuracy and it should not be regarded as a complete analysis of the subjects discussed. All expressions of opinion reflect the judgment of the author on the date of publication and are subject to change. This publication does not involve the rendering of personalized investment advice.

Past performance may not be indicative of future results. Therefore, no current or prospective client should assume that the future performance of any specific investment or strategy will be profitable or equal to past performance levels.  All investment strategies have the potential for profit or loss. Changes in investment strategies, contributions or withdrawals, and economic conditions may materially alter the performance of your portfolio. Different types of investments involve varying degrees of risk, and there can be no assurance that any specific investment or strategy will be suitable or profitable for an investor. Charts and references to returns do not represent the performance achieved by Equitas Capital Advisors, LLC, or any of its clients.

Asset allocation and diversification do not assure or guarantee better performance and cannot eliminate the risk of investment losses. There can be no assurances that an investor’s portfolio will match or outperform any particular benchmark. 

How to Lose Half Your Money in Government Bonds

Yes, you can lose half your money in government guaranteed bonds. The iShares index ETF “TLT” of 20-year treasury bonds shown below has lost half its value in the last 3 years. Some bonds, 30-year Treasuries for example, have been impacted even worse. Long time clients are well familiar with Equitas’s position on bonds having written KnowRisk reports “Return-Free Risk” in 2012 and “The Warning Label” 2014. Did we know that treasury bonds would lose half their value? No, we just thought that a 1% yield was not worth the risk of investing. Now, we are recognizing the opportunity presented by the highest bond yields in decades.

During the past few months, a confluence of events caused long duration bond yields to surge higher. As you know, surging yields causes bond prices to plumet in the opposite direction. While inflation readings have cooled in recent quarters, the pace appears to have plateaued in September, causing anxiety over future Fed policy actions. One contributing factor has been persistently tight labor markets that have emboldened labor unions to go on strike in recent months. This highlights the degree to which structural forces like income inequality and runaway deficit spending are coming home to roost. Other factors include stubbornly elevated inflation reports and struggling demand for Treasury auctions.

Recently, mortgage rates reached over 8% and many rate-sensitive areas of our economy, like housing, autos, capital goods and retail, to name a few, have begun to buckle. The impact of the rate surge is just beginning to be reflected in the broad economic data, but the impact on the consumer and corporate America is immediate and reflected in the recent poor performance of small-cap and highly levered, economically sensitive stocks.

The Federal Reserve voted early November to hold interest rates steady at 5.5%, marking the first time in nearly two years that it has paused rates at two consecutive meetings. Bond and equity prices have breathed a sign of relief, as the market lowered rates in expectation of a softer approach. This relief may be short lived as rates that remain at this elevated level continue to put stress on the economy, particularly in real estate and some banking institutions.

U.S. federal debt as a percentage of GDP

Even before the prospect of the U.S. financing another foreign war, the U.S. budget deficit has doubled sequentially to over $2 trillion, which is about a third of the entire federal budget for 2024. This is despite a strong job market and healthy economy. More worryingly, this deficit is projected to remain high for the foreseeable future. Recent requests for several hundred billion dollars of incremental defense spending to support our allies adds to this picture. Our national budget is showing signs of stress, with our debt rolling over into much higher carrying costs thanks to higher rates.

Risk assets like equities face an uncertain future. Our research shows that equity prices do not typically hit a bottom until well after the Federal Reserve starts cutting rates. Given this backdrop bond yields of 8% or higher in core plus and unconstrained portfolio’s offer a high target to beat. Since the equity markets have averaged about 10% for the last hundred years, an 8% return in bonds goes a long way. Please contact us to discuss the role of fixed income in your portfolio.

Permanent Inflation

Total Federal spending for fiscal 2023 stands at over $6 trillion with a projected deficit of $2 trillion by the nonpartisan Committee for a Responsible Federal Budget (CRFB). This marks a reversal from last year’s drop, increasing concerns over deficits, inflation, and spending. The proposed budget for FY24 is $6.9 trillion, fanning the flames of the debate over allocations and deficit levels. The 19% inflation experienced since January 2020 is permanent. There are no deflationary plans to bring back price levels to what they were in 2020.

Our best hope, therefore, is only to slow the amount that inflation continues to increase in the future. At the long-term average inflation rate of 3% since the formation of the CPI index in 1919, a dollar depreciates to 74 cents in a decade, and to 22 cents in 50 years.

The dollar has lost over 96% of its value since the Federal Reserve was founded in 1913. Investors are encouraged to strategize for long-term preservation and growth amidst the prevailing economic inflation scenario.

Purchasing power of the U.S. dollar since the founding of the Federal Reserve in 1913

Budget Overview

  • Projected Budget: $5.8 trillion (vs over $6 trillion actual)
  • Discretionary Spending: $1.6 trillion
  • Projected Deficit: $1.2 trillion (vs $2 trillion estimated by CRFB in September)
  • FY24 Projected Budget: $6.9 trillion
  • Increase from FY23: $1.1 trillion
  • FY24 Projected Deficit: $1.8 trillion (26% of the proposed budget)

Economic Projections & Deficit Impact

  • President Biden’s budget proposal is anticipated to curtail the deficit spending by approximately $3 trillion over the next decade which sounds impressive but may be more political since the deficit over the same period is still projected to grow by $17.1 trillion.
  • Economic expansion is projected at 3.8% nominal rate in 2023 and 3.9% nominal rate in 2024, underscored by growing concerns over the pace of debt and deficit which are growing much faster than the economy.

Inflation Outlook

Milton Friedman said the only reason for inflation is the government printing of money. He referred to inflation as “taxation without representation.”

“There is one and only one basic cause of inflation: too high a rate of growth in the quantity of money — too much money chasing the available supply of goods and services. These days, that cause is produced in Washington, proximately, by the Federal Reserve System, which determines what happens to the quantity of money; ultimately, by the political and other pressures impinging on the System, of which the most important are the pressures to create money in order to pay for exploding Federal spending and in order to promote the goal of ‘full employment.’ All other alleged causes of inflation — trade union intransigence, greedy business corporations, spend-thrift consumers, bad crops, harsh winters, OPEC cartels and so on — are either consequences of inflation, or excuses by Washington, or sources of temporary blips of inflation.”
Milton Friedman

The recent inflation surge stems from extensive money printing during the Covid crisis to offset federal budget deficits. Inflation is projected to stabilize to 3.4% by the end of 2023 and possibly to 2.3% in the subsequent years.

Investor Considerations

  • The prevailing fiscal environment and projected economic metrics necessitate astute investment strategies. A focus on long-term growth is imperative to navigate the permanently diminishing value of the currency.
  • A structured, well-informed investment approach is crucial to counterbalance the potential fiscal challenges and leverage the arising opportunities.
  • Areas receiving the most federal dollars are Education (13% increase), Health and Human Services (11% increase), the EPA (19% increase), and the Treasury (15% increase).

Conclusion

  • The evolving fiscal landscape, marked by significant over budget allocations and persistent deficits, demands prudent investment strategies. Balancing risk and opportunity while focusing on value preservation and long-term growth is paramount in the current economic context.
  • If Congress pulls back sharply on spending, or if there is another negative shock to the economy, the potential for job losses, deleveraging, and lower prices on risk assets remains high. Whenever the Federal Reserve begins the next rate cut cycle, long dated bonds stand to benefit.
  • With the recent rise in interest rates, the bond market may offer an opportunity to break even with inflation, but experience no real growth. If the interest earned is consumed, there is no inflation hedge. Growing companies with pricing power and limited debt may enable the equity markets to overcome the downward pressure of inflation, although volatility is historically higher.

Artificial Intelligence (Written by AI)

This is the first KnowRisk Report on the topic of artificial intelligence, written completely by artificial intelligence computers. We asked the computer 3 questions: What are the pros and cons of using AI for investment research? Where will AI be in 5 years? Will AI ever surpass human intelligence? According to the Artificial Intelligence computers, here are some of the key points to consider:

It’s important to note that the effectiveness of AI in investment research depends on the quality of the algorithms, data, and the ability to integrate AI insights with human judgment. Finding the right balance between automated analysis and human decision-making is crucial for successful investment strategies. AI is best used for tasks that involve data analysis, pattern recognition, and processing large amounts of information. It excels at tasks such as:

  • Data processing: AI can efficiently analyze and process vast amounts of structured and unstructured data, identifying patterns, correlations, and anomalies that may not be apparent to humans.
  • Automation: AI can automate repetitive tasks, freeing up human resources for more complex and creative work.
  • Predictive analytics: AI algorithms can make predictions and forecasts based on historical data, enabling businesses to anticipate trends, customer behavior, and market movements.
  • Personalization: AI can analyze individual preferences, behaviors, and past interactions to provide personalized recommendations and experiences.

On the other hand, human input is best used for tasks that involve subjective judgment, intuition, and context understanding. Some areas where human input remains crucial include:

  • Complex decision-making: Humans are adept at considering multiple factors, weighing different perspectives, and making decisions based on intuition, experience, and ethical considerations. This is particularly valuable in situations where there is no clear-cut answer or when dealing with novel or ambiguous scenarios.
  • Creativity and innovation: Humans excel at generating novel ideas, thinking creatively, and coming up with innovative solutions. AI, as of now, lacks the ability to replicate human creativity and imagination.
  • Emotional intelligence: Human interactions often require emotional intelligence, empathy, and understanding. Tasks involving customer service, negotiations, or sensitive situations benefit from the emotional intelligence that humans possess.
  • Ethical considerations: Humans can assess ethical implications and moral dilemmas, making judgments that align with societal values and norms. AI algorithms require human oversight to ensure ethical decision-making and prevent unintended biases or discriminatory outcomes.

The ideal approach is to leverage the strengths of AI and humans in a complementary manner, where AI assists with data-driven tasks and humans provide critical thinking, contextual understanding, and subjective decision-making.

Predicting the precise advancements and changes in AI over a specific timeframe is challenging. However, based on the current trajectory and trends, here are some potential ways AI could differ in 5 years from today:

  • Increased sophistication: AI algorithms are likely to become more sophisticated and capable of handling increasingly complex tasks. Advancements in areas such as deep learning, reinforcement learning, and natural language processing may enable AI systems to have a deeper understanding of context and perform more nuanced tasks.
  • Improved natural language understanding: AI’s ability to comprehend and generate human language is expected to improve significantly. This could lead to more advanced virtual assistants, chatbots, and language translation systems that can communicate more naturally and accurately.
  • Enhanced personalization: AI systems may become better at personalization by leveraging large amounts of user data and preferences. This could result in highly tailored experiences, whether it’s in personalized recommendations, content curation, or customer service interactions.
  • Ethical and responsible AI: As AI’s impact on society grows, there will likely be an increased emphasis on ethical considerations, fairness, and transparency in AI systems. Regulations and frameworks may emerge to ensure responsible AI development, addressing issues such as bias, privacy, and accountability.
  • Continued integration across industries: AI is expected to further integrate into various industries beyond its current applications. Sectors such as healthcare, finance, transportation, and manufacturing may see wider adoption of AI technologies to enhance efficiency, productivity, and decision-making.
  • Improved interpretability and explainability: Efforts to enhance AI’s interpretability and explainability are likely to continue. Researchers and developers are working on techniques to make AI models more transparent and understandable, enabling users to comprehend how decisions are made and increasing trust in AI systems.
  • Increased collaboration between humans and AI: Rather than replacing humans, AI is likely to increasingly augment human capabilities and enable collaborative workflows. AI tools and systems could assist professionals in areas such as research, analysis, and decision-making, working in harmony with human expertise.

It’s important to note that AI development can be influenced by various factors, including technological breakthroughs, societal demands, and ethical considerations. The above predictions are speculative and may not capture the full range of possibilities that could unfold in the next five years.

The question of whether AI will ever surpass human intelligence is a topic of ongoing debate and speculation among experts. There are differing opinions on this matter. Here are two contrasting viewpoints:

  • Technological Optimism: Some experts believe that AI has the potential to surpass human intelligence in the future. They argue that as AI technology continues to advance, it may achieve levels of intelligence and capabilities beyond what humans can comprehend or achieve. This perspective is rooted in the belief that AI’s exponential growth and the ability to continually improve itself could lead to the development of Artificial General Intelligence (AGI) or Superintelligence.
  • Skepticism and Limitations: Others are more skeptical and emphasize the unique qualities of human intelligence. They argue that replicating human intelligence, which encompasses a wide range of cognitive abilities, emotions, creativity, and consciousness, remains a significant scientific and technological challenge. They highlight the complex nature of human cognition and question whether AI can truly replicate all aspects of human intelligence.

It is important to note that the field of AI is still evolving, and the development of AGI or superintelligence is highly speculative. While AI has made impressive advancements in narrow domains, achieving human-level general intelligence or surpassing it is a complex task that presents significant scientific, ethical, and technical challenges.

It’s difficult to predict with certainty whether AI will eventually surpass human intelligence or when such a milestone might occur. Continued research, technological progress, and ethical considerations will shape the trajectory of AI development. Regardless, the focus for now is on leveraging AI as a tool to augment human capabilities and address specific challenges rather than an outright replacement for human intelligence.

Bringing Risk Management to Index Funds

For many companies the phrase “We have always done it this way” are famous last words. Some companies are so large and well-established, it seems like they could never go out of business. However, innovation can quickly leave a business behind if it cannot adjust to new ways of operating, or to changing customer demand for new products and services.

In my lifetime, 88% of the Fortune 500 firms that existed in 1955 are gone. FDIC closed 465 failed banks from 2008 to 2012. USA Today claims 190 banks are in danger of failing today. Here are examples of well-known companies that filed for bankruptcy, went out of business, or needed government bailout in order to survive:

Kodak, Radio Shack, Arthur Anderson, Enron, Circuit City, Blockbuster, Pan Am, Tower Records, Polaroid, Ringling Bros., Gawker, Solyndra, Pets.com, Compaq, American Apparel, Luby’s, Ann Taylor

Merrill Lynch, Lehman Brothers, Wachovia, Lloyds TSB, UBS, Royal Bank of Scotland, AIG, Fortis, Pier 1 Imports, Borders, Sports Authority, Toys R Us, Payless Stores, Gymboree, Dress Barn, Papyrus, Loft

General Motors, Chrysler, Sears, Alta Motors, A&P Supermarket, Modell’s, Lord and Taylor, JCPenney’s, Neiman Marcus, Guitar Center, Gibson, GNC, J. Crew, Brooks Brothers, Tailored Brands, Stein Mart, Barneys

Almost ALL of these companies were part of an index. Some were ridden all the way into bankruptcy. Some were kicked out of the index when they no longer met the basic qualifications for inclusion. This was usually done closer to the bottom than the top.

The economy and therefore the stock markets, are everchanging and dynamic. There is an old Wall Street adage; “Every time you find the key, they change the lock.” Portfolios invested in companies need to keep up and hopefully stay ahead of the change in order to protect and grow capital.

The traditional 60/40 mix of stocks and bonds is an example. It is the most common, widest held, asset allocation for individuals and institutions. However, lately it has proven to be out of date. The Wall Street Journal publishes articles on the debate whether the 60/40 is dead. If it is dead, when did it die? It was certainly dead in 2022! But it died before that. Here is why.

The 60/40 was built on long term (100 year) average returns where stocks average about 10% and bonds about 6%. Blended together the return is around 8% which is the historical actuarial interest rate assumption for many pension plans, and the target return for most endowments and foundations. Given those rate assumptions, the 60/40 works just fine. But when the return of the 40% in bonds goes from 6% to 1%, the model breaks down. Too much pressure is put on the 60% in stocks to make up. The return on a global 60/40 portfolio indexed for the last 10 years is 4.76% as of yearend 2022. In other words, using only indexes, you can’t get there from here.

Diversifying into alternatives is becoming a popular solution. Alternative assets provide additional diversification with less correlated assets. Typically, alternative assets include private equity, hedge funds, real estate, futures, etc. which can help diversify and provide a portfolio. The current model for many investors has evolved from 60/40 into a 40/30/30 portfolio, with the last 30% in alternatives. Equitas is world class in alternative investing. In 2021 our alternative fund won Multi-Strategy Fund of the Year awards from HFM and HedgeWeek, and ranked within the top 10 in our category of the Bloomberg Database worldwide for the preceding 1, 3, 5, and 10-year periods.

Adding alternatives can be a good diversifier, but most investors have a limit to the allocation of alternatives in their portfolio. Plus, alternatives do nothing for the systemic risk of the indexes or traditional money managers used in the core of the portfolio.

Our mission at Equitas is to engineer financial solutions for our clients. When we see a need, we search the market to provide, or engineer a solution. We started this project by researching the universe of all the tactical investment advisors. We were disappointed. While the tactical investment managers did protect from some of the downside, they also protected from the upside. The average manager performed approximately 4% for approaching 10 years. 4 is only half way to 8. It does not cover the 5% spending policy of foundations and makes a pension plan over 40% underfunded in 10 years.

By partnering with Ned Davis Research and Nasdaq Dorsey Wright, Equitas has created a solution to index funds’ problem of a lack of risk management which we call the Navigator. A typical index fund doesn’t utilize any relevant technical research and little fundamental information beyond market capitalization and some selection criteria. The index philosophy is an efficient, low cost way to buy and hold the market. However, the philosophy is don’t sell at the bottom when the market drops, and wait for the index to come back from the decline maybe years later. That may be fine for a 30-year-old investor, but indexes can have prolonged down periods which can be unnerving for others, especially investors that need cash flow like pensions, foundations, and retirees. For example, it took the Nasdaq Index 15 years to come back to even from the Y2K blow up of 2000! The static strategy of the 60/40 index portfolio is inflexible and out of date. The locks have been changed. Investment portfolios need to be flexible and to breath in order to play offence in the up markets, and defense to protect capital in declining markets.

Our three Equitas Navigator Strategies include a bond strategy, a stock strategy, and a global (combined bond & stock) strategy. The Equitas Global Navigator Strategy has a historical average of about 60% stocks and 40% bonds. However, this allocation fluctuates significantly, and rarely looks like the average. The Navigator System uses fundamental and technical indicators with the aim to add risk management into index funds.

Fundamental indicators tell us what to buy. Technical indicators tell us when. The strategy is not static. It is dynamic. It rebalances monthly. The Navigator can breathe life into a portfolio by being defensive or offensive based on the indicators. The defense shows up well in 2022 when the indicators went into T-Bills to protect capital. The offense shows up well in 2021 where it out performed the broad 60/40 index with a concentration into the asset classes with the highest sentiment and momentum.

Inflation & Interest Rates

Inflation remains THE topic for today and the Fed continues aggressively raising rates to bring it under control. There is current thinking that we are in the 1970s again. While there are similarities, important dissimilarities are worth pointing out. History does not exactly repeat, but it does rhyme.

Commodity prices are a large part of inflation; however, many have already peaked and are falling. Gold is one of the main inflation indicators, but gold has fallen from 2075 to 1650 the last 2½ years which is a 20% drop. Five years ago, it was 1,428 so it is still up 17% after the drop. Other commodities falling from peak levels include: Lumber -62%, Copper -27%, iron ore -59%, DRAM chips -50%, Housing -20%, Steel -48%, and the Baltic Freight Index -78%, and Oil -31%. Oil may get a bounce since the Saudi announcement to cut 2M barrels of daily production. The Fed Chairman has stated that there will be no need for the aggressive rate hike tactics after inflation subsides. Could it be happening already?

Gold price versus other inflation indicators

The international markets are weak and the dollar is incredibly strong. The dollar is stronger now against the British Pound, than when we were still on the gold standard! And this is after adding $30T to the US debt. The dollar is just about on parity against the Pound and the Euro. The dollar may weaken going forward which creates a tail wind of opportunity for foreign investing that we have not had for several years.

U.S. dollar strength against the British Pound and Euro

The overly aggressive Federal Reserve may have already accomplished its goal and may have actually over achieved its goal but it does not look like they are stopping yet. The federal fund’s rate is now up from 0.25% to 3.13% and the futures are trading at 4.5% for June of 2023 and then falling off. The effects of interest rate hikes take a while to flow through the economy as projects and new hires are postponed or cancelled. It may be six months to a year from now before the results are more fully reflected by economic statistics.

We are definitely in a recession, as classically defined as 2 quarters of negative GDP Growth. Correspondingly, auto loan delinquencies are back to 2008 levels. However, some indicators are contradictory such as unemployment which remains at a low of 3.5% with a 50-year average of 6.2%. Both private equity managers and distressed debt can benefit long term from the opportunities of lower cost purchases. The traditional 60% stock / 40% bond investment strategy has been a disaster. This is the worst year in 50 years for stocks and the worst year EVER for bonds.

Private equity managers should benefit long term from the opportunities of lower cost purchases but they take years to work out. PE vintage years during recessions tend to do better over the fund life. JP Morgan is saying “alternatives are not optional, but mandatory.” Our hedged investments have hedged and some are positive for the year. Distressed debt is a cyclical strategy whose time has come. By the end of 2023 if rates stop rising, traditional bonds may become attractive for the first time in over a decade. While you wait roll T-Bills and make 3%.

Traditional managers and index funds have a harder time because they tend to remain fully invested. There is not as much tactical risk management in the industry today as in years gone by. The technical swings of human nature are a powerful force affecting investments and may have little to do with the economic fundamentals. We have been working on a solution for this and have partnered with the large research firms of Ned Davis Research and the NASDAQ owned Dorsey Wright for tactical indicators to bring in more risk management. Interestingly, the falling stock market so far been driven more by the technical multiple compression on the Price to Earnings ratio more so than falling earnings. Year to date the PE ratio has dropped by -29.7%, the main driver resulting in the S&P 500 return of -24.8%.

When inflation does subside, and the fed does not have to remain so aggressive, a whole new chapter will open up for the stock and bond markets. The markets usually start moving up BEFORE the recession ends. It is important to be ready and positioned well for this inevitability.

Does Your Financial Advisor Use the “F” Word?

Does Your Financial Advisor Use the “F” Word?

They should, especially when “F” stands for Fiduciary.

A Fiduciary is a financial advisor who makes investment decisions that are in the best interest of the client. Sounds obvious, right? But not all money managers are Fiduciaries. Many stockbrokers and others in financial sales make commissions when they sell certain products, so they will naturally push those investments to clients.

Fiduciaries are bound to avoid conflicts of interest and to find solutions for clients, not products to sell them.

The term Fiduciary applies to more than just Certified Financial Planners. Lawyers have a Fiduciary duty to clients. Board Members to the organizations and businesses they represent. Real Estate agents, too.

But too often, people trust their money to friends or acquaintances without making sure they are Fiduciaries. Maybe you play golf with them. Or you worked the grill together at the school fundraiser. When it comes to investments, people often go with the wrong “F” word, choosing a friend over a Fiduciary.

If you want to grow your portfolio a Fiduciary is the best person to entrust it to. Unlike bank or brokerage firm employees, Fiduciaries make decisions with your specific goals in mind vs. what employers incentivize representatives to advise. This alignment of interests is what truly makes working with a Fiduciary extremely beneficial.

So how can you make sure you’re working with a Fiduciary?

While there is no certification or required education to become a Fiduciary, the term is indeed a legal one. Fiduciaries will attest their professional status in writing; ask them to do so. And to sign it.

Also, ask your financial advisor up front if they get paid on commission. They shouldn’t. If you are working with a Fiduciary, she will discuss a flat fee or percentage rate at the outset of your relationship.

Another sign that you are working with a Fiduciary is if, during your first meeting, they ask you questions specific to your cash flow needs and risk tolerance. A Fiduciary may also ask when and how do you want to retire, putting your goals ahead of theirs and creating a long-term plan that is in your best interest.

So go ahead. Use the “F” word.

You will be happy you did.

In 2002, Equitas Capital Advisors, LLC was established as a unique company that blends the resources of a large global corporation with the flexibility of a small boutique firm. The registered service mark of Equitas Capital Advisors is Engineering Financial Solutions® and the purpose of Equitas is to design, build, and deliver investment solutions to meet the goals and objectives of our investors. Equitas Capital Advisors, LLC located in New Orleans, has over 200 years of combined investment management consulting experience providing professional investment management services to investors such as foundations, endowments, insurance companies, oil companies, universities, corporate retirement plans, and high net worth family offices.

Disclosures and Disclaimers:
Above information is for illustrative purposes only and has been obtained from reliable sources but no guarantee is made with regard to accuracy or completeness. It is not an offer to sell or solicitation to buy any security. The specific securities used are for illustrative purposes only and not a recommendation or solicitation to purchase or sell any individual security.

Equitas Capital Advisors, LLC is registered as an investment advisor with the U.S. Securities and Exchange Commission (“SEC”) and only transacts business in states where it is properly registered, or is excluded or exempted from registration requirements. SEC registration does not constitute an endorsement of the firm by the Commission nor does it indicate that the advisor has attained a particular level of skill or ability.

Information presented is believed to be factual and up-to-date, but we do not guarantee its accuracy and it should not be regarded as a complete analysis of the subjects discussed. All expressions of opinion reflect the judgment of the author on the date of publication and are subject to change. This publication does not involve the rendering of personalized investment advice.

Charts and references to returns do not represent the performance achieved by Equitas Capital Advisors, LLC, or any of its clients.

Asset allocation and diversification do not assure or guarantee better performance and cannot eliminate the risk of investment losses.

All investment strategies have the potential for profit or loss. There can be no assurances that an investor’s portfolio will match or outperform any particular benchmark. Past performance does not guarantee future investment success.

Commodities 101

The S&P 500 posted its worst first half of the year since 1970, down 20% through Second Quarter 2022. Worries about surging inflation and Federal Reserve rate hikes hurt valuations, as did Russia’s ongoing war on Ukraine and Covid-19 lockdowns in China. Bonds, down 10% for the same period, had their worst year since 1788. Only one broad asset class seems to have escaped the carnage this year: commodities, which ended the quarter up 18% for the year.

Defined as useful goods with interchangeable properties, commodities include energy, agricultural goods, metals and raw materials. The Goldman Sachs Commodity Index (GSCI), now owned and maintained by S&P, is a common index used to represent the commodities market. The index is weighted according to average world production in five sectors over the past five years. Energy is the largest commodity sector at 54% of the index, with Crude Oil alone at 50%. Wheat, corn and soybeans are the majority of agriculture at 16% of the total. This means that factors affecting the price and production of oil often have a large impact on the commodity sector as a whole. The index performance is created by tracking performance of future contracts.

A futures contract is a legal agreement that obligates the parties to buy and sell a specific amount of a certain commodity at a specified time in the future. The largest volumes of futures contracts are typically traded for the “front months” or the nearest expiration date contracts for a given commodity. The average daily volume of contracts traded typically exceeds the average daily use of the commodity. This results from both commodity related companies hedging their own exposure and also non-related market participants seeking to profit from predictions that differ from the market.

Futures curve illustrating contango and backwardation

The spread between the underlying security’s front month futures price and its spot (immediate) price will usually narrow until converging at expiration. When the spot price is lower than futures month, the market is in contango. When the spot price is higher than the front month, the market enters backwardation. Primarily, a shortage of a commodity in the present and/or an estimated oversupply in the future cause backwardation. Commodity traders can harvest this differential as long as the market remains in a deficit by moving their exposure from the front month into longer dated contracts, which are expected to increase.

S&P 500 sector breakdown compared to commodity-related sectors

Since the beginning of the first human societies from 9,000-6,000 BC, commodities have functioned as a valuable part of our economy. Farming, mining, and logging were once the vast majority of human economies across the globe. However, at the end of the Second Quarter 2022, the materials and energy sectors combined represent only 7% of the S&P 500. The rest of the economy is now dominated by other sectors like Information Technology at 27% and Health Care at 15%. Even though commodity related companies are currently such a small part of the publicly traded index, they deserve a closer look for their unique performance.

Outside of direct futures contracts, investors can gain access to commodity exposure through several different vehicles. The main underlying exposures are either the commodity itself through futures, or through securities of companies that are directly involved with the commodity such as oil drillers. These securities can be accessed directly, which come with company specific risk. Exchange Traded Funds (ETFs) offer a basket of related companies in order to diversify company specific risk while retaining commodity and equity exposure. Invesco, iShares and many others offer both diversified and sector-based commodity exposure. Finally, accredited investors can access alternative strategies that combine long and short exposure with other hedging. The chart below compares exposure to oil futures (United States Oil ETF) with the companies drilling that oil (Energy Equities ETF). The broad commodities futures index is also on the chart, along with an alternative strategy that uses both long and short positions in commodities, combined with other hedges. The right strategy for you depends on your specific goals and tolerances.

Performance comparison of oil futures, drilling equities, and alternative commodity strategies

Baby, It’s (Maybe Getting) Cold Outside

Baby, It’s (Maybe Getting) Cold Outside

alt=”” loading=”lazy” srcset=”https://equitas.capital/wp-content/uploads/2022/07/Screen-Shot-2022-07-01-at-10.04.43-AM-845×1024.png 845w, https://equitas.capital/wp-content/uploads/2022/07/Screen-Shot-2022-07-01-at-10.04.43-AM-248×300.png 248w, https://equitas.capital/wp-content/uploads/2022/07/Screen-Shot-2022-07-01-at-10.04.43-AM-768×931.png 768w, https://equitas.capital/wp-content/uploads/2022/07/Screen-Shot-2022-07-01-at-10.04.43-AM.png 1000w” sizes=”(max-width: 800px) 100vw, 800px” />

How to protect your investment portfolio from rising interest rates.

The smoking hot U.S economy is thawing out.

Nasdaq is down.

Inflation is up. But you can’t invest directly in it.

Will the economy chill even more? Turn downright cold? Nobody knows for sure.

But what we do know is that there are steps investors can take to protect portfolios in times of high inflation and rising interest rates. With the right planning, your portfolio can limit downside and even find pockets of upside in a cooling economy.

A few tips:

1. Ask your advisor about commodities
As the only broad category of investment that has been positive year to date, commodities continue to make money. Agricultural commodities such as soybeans and corn, along with energy and oil and gas, continue to have high consumer demand despite rising costs due to inflation and the stressed supply chain. Consider a 5% allocation of your portfolios in commodities.

2. But don’t forget to consider political risks
Energy companies, like ExxonMobil, are enjoying high prices for the oil they sell, but White House leadership concerned with climate change and other environmental issues may affect the value of energy stocks.

3. Look for dividends
Seek out mature companies that are paying dividends, especially if they have a history of increasing those dividends. When the economy is hot and interest rates are low, people tend to be attracted to exciting new companies like Tesla or Facebook (now Meta). But when the economy is cooling down, companies that are not heavily reinvesting into their businesses can give profits back to the company’s stockholders. Now is a good time to revisit old reliables, such as IBM and Philip Morris International.

4. Avoid debt-heavy companies
Companies with big loans will have bigger bills to pay as rates increase, making it harder for them to balance their budgets. Instead, look for companies with low debt that can maintain earnings with little investment. Some tech companies can fit that mold, especially if they have other features in this list.

5. Look for companies with pricing power
Companies that have a strong market position and few competitors can raise prices as needed. One example is an MLP (Master Limited Partnership) pipeline, which basically moves oil from the well to distribution centers.

6. Two words: real estate
Mortgage rates have risen off the bottom, yet remain near historic lows. Additionally, construction of new housing has trended under the rate of household formation since the financial crisis in 2008, so concerns of oversupply are mellowed. If you buy now and secure a fixed rate mortgage, your monthly payments will stay at that level. For a $300,000 loan, every 1% increase means an extra $200 payment a month or an extra $2,400 a year. Real Estate Investment Trusts (REIT) also deserve a closer look. Rising rents help battle rising rates. REITs have diversified in areas like data centers and cell towers, beyond the old retail and office sectors which are a lower slice of the market.

7. Lean toward value equity and international equity asset classes
Tilting, not over-investing, in these areas during high inflation can be a smart idea. A recent Equitas study showed these asset classes perform better in times of higher inflation, perhaps because both categories start at lower price-to-earnings ratios than the S&P 500. History is no guarantee, but during periods of rising interest rates, we tend to see price-to-earnings ratios flatten out.

As the Fed raises the interest rates to counter the effects of inflation, the U.S. economy is sure to cool down. But with the right planning, you can make sure your portfolio remains hot.

SEE FULL ARTICLE:


Biz New Orleans

In 2002, Equitas Capital Advisors, LLC was established as a unique company that blends the resources of a large global corporation with the flexibility of a small boutique firm. The registered service mark of Equitas Capital Advisors is Engineering Financial Solutions® and the purpose of Equitas is to design, build, and deliver investment solutions to meet the goals and objectives of our investors. Equitas Capital Advisors, LLC located in New Orleans, has over 200 years of combined investment management consulting experience providing professional investment management services to investors such as foundations, endowments, insurance companies, oil companies, universities, corporate retirement plans, and high net worth family offices.

Disclosures and Disclaimers:
Above information is for illustrative purposes only and has been obtained from reliable sources but no guarantee is made with regard to accuracy or completeness. It is not an offer to sell or solicitation to buy any security. The specific securities used are for illustrative purposes only and not a recommendation or solicitation to purchase or sell any individual security.

Equitas Capital Advisors, LLC is registered as an investment advisor with the U.S. Securities and Exchange Commission (“SEC”) and only transacts business in states where it is properly registered, or is excluded or exempted from registration requirements. SEC registration does not constitute an endorsement of the firm by the Commission nor does it indicate that the advisor has attained a particular level of skill or ability.

Information presented is believed to be factual and up-to-date, but we do not guarantee its accuracy and it should not be regarded as a complete analysis of the subjects discussed. All expressions of opinion reflect the judgment of the author on the date of publication and are subject to change. This publication does not involve the rendering of personalized investment advice.

Charts and references to returns do not represent the performance achieved by Equitas Capital Advisors, LLC, or any of its clients.

Asset allocation and diversification do not assure or guarantee better performance and cannot eliminate the risk of investment losses.

All investment strategies have the potential for profit or loss. There can be no assurances that an investor’s portfolio will match or outperform any particular benchmark. Past performance does not guarantee future investment success.

Portfolio Strategy for Rising Interest Rates

What are some ways investors should change their strategies with rising interest rates?

alt=”” loading=”lazy” srcset=”https://equitas.capital/wp-content/uploads/2022/07/Screen-Shot-2022-07-01-at-10.03.45-AM.png 846w, https://equitas.capital/wp-content/uploads/2022/07/Screen-Shot-2022-07-01-at-10.03.45-AM-272×300.png 272w, https://equitas.capital/wp-content/uploads/2022/07/Screen-Shot-2022-07-01-at-10.03.45-AM-768×846.png 768w” sizes=”(max-width: 800px) 100vw, 800px”>

A balanced portfolio, and one meant to withstand rising interest rates, includes investment in companies with pricing power. Look for companies that have strong market position and few competitors — they can raise prices as needed. An example is an MLP (Master Limited Partnership) pipeline, which basically moves oil from the well to distribution centers. Avoid expensive growth stocks, especially those without profits, and avoid longer-dated fixed income.

SEE FULL ARTICLE:


Biz New Orleans

In 2002, Equitas Capital Advisors, LLC was established as a unique company that blends the resources of a large global corporation with the flexibility of a small boutique firm. The registered service mark of Equitas Capital Advisors is Engineering Financial Solutions® and the purpose of Equitas is to design, build, and deliver investment solutions to meet the goals and objectives of our investors. Equitas Capital Advisors, LLC located in New Orleans, has over 200 years of combined investment management consulting experience providing professional investment management services to investors such as foundations, endowments, insurance companies, oil companies, universities, corporate retirement plans, and high net worth family offices.

Disclosures and Disclaimers:
Above information is for illustrative purposes only and has been obtained from reliable sources but no guarantee is made with regard to accuracy or completeness. It is not an offer to sell or solicitation to buy any security. The specific securities used are for illustrative purposes only and not a recommendation or solicitation to purchase or sell any individual security.

Equitas Capital Advisors, LLC is registered as an investment advisor with the U.S. Securities and Exchange Commission (“SEC”) and only transacts business in states where it is properly registered, or is excluded or exempted from registration requirements. SEC registration does not constitute an endorsement of the firm by the Commission nor does it indicate that the advisor has attained a particular level of skill or ability.

Information presented is believed to be factual and up-to-date, but we do not guarantee its accuracy and it should not be regarded as a complete analysis of the subjects discussed. All expressions of opinion reflect the judgment of the author on the date of publication and are subject to change. This publication does not involve the rendering of personalized investment advice.

Charts and references to returns do not represent the performance achieved by Equitas Capital Advisors, LLC, or any of its clients.

Asset allocation and diversification do not assure or guarantee better performance and cannot eliminate the risk of investment losses.

All investment strategies have the potential for profit or loss. There can be no assurances that an investor’s portfolio will match or outperform any particular benchmark. Past performance does not guarantee future investment success.

5 Tips to Protect Your Portfolio from Rising Rates

5 tips to protect your investment portfolio from rising interest rates

alt=”Derek L. Fossier” loading=”lazy” srcset=”https://equitas.capital/wp-content/uploads/2018/07/Small-Size-25-1024×683.jpg 1024w, https://equitas.capital/wp-content/uploads/2018/07/Small-Size-25-300×200.jpg 300w, https://equitas.capital/wp-content/uploads/2018/07/Small-Size-25-768×512.jpg 768w, https://equitas.capital/wp-content/uploads/2018/07/Small-Size-25.jpg 1199w” sizes=”(max-width: 800px) 100vw, 800px” />

The economy is hot. So hot, in fact, that it is overheating.

The unemployment rate is down to a low 3.6%. Consumers have saved an additional $2.5 trillion in additional savings now vs. pre-pandemic. Earnings are up.

So what’s the problem?

These indicators are backward looking. They don’t account for the current 40 year-high inflation rate. The Consumer Price Index reached 8.5% in March compared to one year ago, arriving at a level not seen since the late 1970s. Meanwhile, prices for cars and gasoline rose 40%.

To rein in our unrestrained optimism – and the inflation that accompanies it – the Federal Reserve has said it will raise interest rates dramatically before the end of 2022.

With the right planning, your portfolio can maintain despite the radically changing conditions coming down from the Federal Reserve.

So what can you do to protect your portfolio from actions the Fed will take to reduce inflation?

  • Avoid debt-heavy companies. Companies with big loans will have bigger bills to pay as rates increase, making it harder for them to balance their budgets. Instead, look for companies with low debt that can maintain earnings with little investment. Tech companies can fit that mold, especially if they have other features in this list.
  • Look for companies with pricing power. Companies that have a strong market position and few competitors can raise prices as needed. One example is an MLP (Master Limited Partnership) pipeline, which basically moves oil from the well to distribution centers. Avoid utilities and railroads which tend to have debt and are heavily regulated.
  • Real estate. Mortgage rates have risen off the bottom, yet remain near historic lows. If you buy now and secure a fixed rate mortgage, your monthly payments will stay at that level. For a $300,000 loan, every 1% increase means an extra $200 payment a month or an extra $2400 a year. Real Estate Investment Trusts (REIT) also deserve a closer look. Rising rents help battle rising rates.  REITs have diversified in areas like data centers and cell towers, beyond the old retail and office sectors which are a lower slice of the market.
  • Bonds. Thanks to their low correlation and low volatility, bonds have a place in many portfolios. Consider the coming months to be two cycles: bonds should be shorter duration in the first cycle of rising rates and inflation. If a recession starts to hit from repeated rate hikes, the Federal Reserve will pause and may even lower rates. Look for longer dated bonds in this second cycle.
  • Invest in value equity and international equity asset classes. Tilting, not over-investing, in these areas during high inflation can be a smart idea. A recent Equitas study showed these asset classes perform better in times of higher inflation, perhaps because both categories start at lower price to earnings ratios than the S&P 500. History is no guarantee, but during periods of rising interest rates, we tend to see price to earnings ratios flatten out.


In short, during a time of higher interest rates and inflation, its best to own productive assets and stay away from higher duration bonds (10 to 30 years) that don’t increase payments when inflation rises.

But no matter what, investors should not panic when interest rates rise and the Federal Reserve steps in to enact changes to slow down the economy. Because what Charles Dow said back in 1900 continues to hold true – “the fact pertaining to all conditions is that they will change.”

Just make sure your portfolio is prepared to not only withstand the changes coming from the Federal Reserve, but to anticipate and work them into your investing strategy.

SEE FULL ARTICLE:


New Orleans City Business

In 2002, Equitas Capital Advisors, LLC was established as a unique company that blends the resources of a large global corporation with the flexibility of a small boutique firm. The registered service mark of Equitas Capital Advisors is Engineering Financial Solutions® and the purpose of Equitas is to design, build, and deliver investment solutions to meet the goals and objectives of our investors. Equitas Capital Advisors, LLC located in New Orleans, has over 200 years of combined investment management consulting experience providing professional investment management services to investors such as foundations, endowments, insurance companies, oil companies, universities, corporate retirement plans, and high net worth family offices.

Disclosures and Disclaimers:
Above information is for illustrative purposes only and has been obtained from reliable sources but no guarantee is made with regard to accuracy or completeness. It is not an offer to sell or solicitation to buy any security. The specific securities used are for illustrative purposes only and not a recommendation or solicitation to purchase or sell any individual security.

Equitas Capital Advisors, LLC is registered as an investment advisor with the U.S. Securities and Exchange Commission (“SEC”) and only transacts business in states where it is properly registered, or is excluded or exempted from registration requirements. SEC registration does not constitute an endorsement of the firm by the Commission nor does it indicate that the advisor has attained a particular level of skill or ability.

Information presented is believed to be factual and up-to-date, but we do not guarantee its accuracy and it should not be regarded as a complete analysis of the subjects discussed. All expressions of opinion reflect the judgment of the author on the date of publication and are subject to change. This publication does not involve the rendering of personalized investment advice.

Charts and references to returns do not represent the performance achieved by Equitas Capital Advisors, LLC, or any of its clients.

Asset allocation and diversification do not assure or guarantee better performance and cannot eliminate the risk of investment losses.

All investment strategies have the potential for profit or loss. There can be no assurances that an investor’s portfolio will match or outperform any particular benchmark. Past performance does not guarantee future investment success.

Don’t Fight the Fed

To support the economy after COVID, the Federal Reserve massively increased their holdings of mortgages and bonds, totaling $9 trillion by the end of first quarter 2022. That monetary stimulus, combined with fiscal stimulus from Congress, created an economy so hot that it is overheating. Russia’s invasion of Ukraine had a small contribution as well, functioning as a wake-up call to investors. The consumer price index (CPI), a general measure of inflation, reached 8.5% in March to arrive at a level not seen since the end of the Carter administration. The producer price index (PPI) is seen as a leading indicator and is shown below with the longer running finished goods index. The PPI has risen higher to 11.2% a level also not seen for decades. Both measures appear on the upswing and rising dramatically.

To address the overheating, the Federal Reserve recently signaled a change to higher rates and an unprecedented unwinding of their largest ever balance sheet. Rather than continuing to purchase Treasuries and mortgages, the central bank will now shrink their holdings by $95 billion a month. If buying these bonds supported markets, unwinding them is likely to have the opposite effect. The hope is that these actions will be strong enough to slow the economy without being so strong that they send us into a recession.

Federal Reserve total assets

Given the previously outlined scenario, one would expect the market to be cautious. However, after a brief drop from the beginning of the year to mid-March, the market rallied back almost to previous highs. On the surface the economy is running stronger than it has in decades, demonstrated by an unemployment rate down to 3.6% and $2.5 trillion in additional consumer savings now vs pre-pandemic. Earnings season will generate headlines reflecting that boom in our economy, but we need to remember that those earnings are backward looking. The central bank’s planned actions hope to reign in that unrestrained optimism by the end of the year.

At the latest Fed meeting, their own projections indicated 50 basis point increases (double the normal amount) at each of the three remaining meetings of the year. “I would like to get there in the second half of this year… We have to move,” to get ahead of inflation running at triple the Fed’s 2% target, Bullard said. “We are talking about bigger moves than we have made in a long time.” These actions by the Federal Reserve should create an environment very different from the one we are in now, especially when combined with balance sheet reductions of $95 billion per month. Luckily, we have seen similar environments before.

In our annual update of our investment projections, Equitas looked specifically at asset class behavior in both a rising rate environment and also in a high inflation environment. The charts below represent a portion of the research Equitas has performed on both rising rates and rising inflation environments. A few differences immediately jump out, particularly the wild variance in performance of growth and mid cap equity. Some asset classes appear to weather both periods satisfactorily, like value equity, international equity, and real assets such as property and commodities.

Asset class performance across rate and inflation regimes

As we continued our research, the growth of the underlying economy emerged as the key factor on asset class performance. If inflation is high and rates are increasing because the underlying economy is doing well, most risk assets (including equities) will also do well. However, if there is a shock, or if rates increase enough to be a shock themselves, the economy risks recession with negative impacts on most asset class. Bonds and MLP pipelines have historically held up better under these conditions.

Asset class performance in high-growth versus low-growth environments

Timing the transition of the economy is extremely difficult even for experts. One frequently watched barometer is the relationship between long dated bonds and shorter dated bonds, represented by the spread between 10-year and 2-year treasury notes. Typically, the yield on longer bonds is higher to compensate for the longer time period, but in periods of stress, short term lending is considered riskier with a higher yield. Traditional wisdom says that recessions come within two years of an inverted yield curve. This relationship is shown in the graph below.

Yield curve spread between 10-year and 2-year Treasury notes

The uncertainty of timing leads to our preference in crafting a strategic allocation that can perform reasonably in most markets, with an overweight on classes that have shown resiliency. We also prefer active managers who are able to find low debt companies with pricing power for their potential to outperform index returns over the long run. As always, we are keeping our eyes towards rebalancing back to target as opportunities present themselves.

“There is always a disposition in people’s minds to think the existing conditions will be permanent. When the market is down and dull, it is hard to make people believe that this is the prelude to a period of activity and advance. When the prices are up and the country is prosperous, it is always said that while preceding booms have not lasted, there are circumstances connected with this one, which make it unlike its predecessors and give assurance of permanency. The fact pertaining to all conditions is that they will change.”
Charles Dow, 1900

2021: A COVID Odyssey

Similar to Stanley Kubrick’s 2001: A Space Odyssey, the stock market in 2021 was a COVID odyssey. After a constructive October, US equities surged in November with the S&P 500 reaching, at the time, all-time highs. However, the emergence of the Omicron COVID-19 variant and concerns about the efficacy of existing vaccines sent stock prices and bond yields tumbling post-Thanksgiving. Investors were further unnerved by a more hawkish tone from Fed Chair Powell the following week, who said it was no longer appropriate to call inflation “transitory” and cited the strength of the US economy when saying that a faster tapering of asset purchases was under consideration. The S&P 500 finished November down slightly, posting a loss of -0.83%, but turned around to reach fresh all-time highs by the end of December.

The Federal Reserve addressed inflation in their December commentary: “Supply and demand imbalances related to the pandemic and the reopening of the economy have continued to contribute to elevated levels of inflation. Overall financial conditions remain accommodative.” The chart below illustrates two ways to look at inflation, Producer Price Index (PPI) and Consumer Price Index (CPI). PPI measures the average change over time in selling prices received by domestic producers of goods and services while CPI does this same analysis from the purchaser’s viewpoint. When producers must pay more to produce their goods (an increase in PPI) they must make a choice. They may absorb the additional costs, thereby reducing profits; or they may pass these higher costs on to consumers. Since corporate profits are the lifeblood of stock prices, the more likely course is to pass these additional costs along to the consumer, thus pushing inflation (CPI) higher. In order to fight the resulting price inflation, the Fed customarily raises interest rates.

One way to slowly raise rates is by decreasing net monthly asset purchases by the Federal Open Market Committee (FOMC). On a daily basis, the FOMC purchases and sells bonds in the marketplace to move rates in the direction it is targeting. At a high level, net bond purchases by the FOMC result in higher bond prices and lower rates. Net bond sales would result in lower bond prices and higher rates. As the chart below indicates, the FOMC has slowly changed their inflation and interest rate expectations over the last year. In December of 2020, they expected no need to raise rates through 2023. Come June 2021, the expectation was that rates would need to go up by 0.5% over the same period. Lastly, by December of 2021, that expectation grew considerably to reflect a need to raise rates by up to 1.5%! Around March of 2022, net asset purchases should be in balance, allowing flexibility for Fed Funds Rate increases to start occurring. While we do not attempt to predict events here at Equitas, markets seem to be expecting three or four rate increases in 2022 and a similar number the following year.

FOMC interest rate expectations evolving through 2022

What does this mean for investments? In general, rising rates tends to be a headwind for many areas of the fixed income markets. As newly issued bonds pay higher coupons, older bonds issued with lower rates become less attractive to investors. They are thus sold off by investors looking to invest at “current” coupons. The prices on these bonds drop until they reach parity whereby one is indifferent owning the older (lower coupon) bond at a newfound discount versus the newly issued bond at market price. As for equity investments, rising rates can be a mixed bag. For the most part, if companies are viewed as slowing their growth or becoming less profitable, the estimated amount of future cash flows will drop. All else being equal, this will lower the price of the company’s stock. However, some sectors stand to benefit from interest rate hikes. For example, banks, brokerages, mortgage companies, and insurance companies can often increase earnings because they can charge more for lending than they were able to at lower interest rates.

In summary, while the relationship between interest rates and equity markets is more indirect than that of the bond market, the correlation between the two is actually somewhat vague. This is largely because the Federal Reserve only raises rates when the economy is already running hot. However, there is no guarantee as to exactly how the market will react to any given interest rate change. As shown in the chart below, markets can, and often do, continue to rise even after the Fed begins to raise rates. According to Blackrock’s Russ Koesterich, CFA, JD, “It is true that there have been historical periods, notably the ’70s and early ’80s, when higher rates coincided with lower valuations and poor returns. That said, the relationship between rates and stocks changes when rates are very low. At current levels the relationship between interest rates and valuations has been more ambiguous. At least historically, stock valuations have been more likely to rise than fall when rates are rising from low levels, as is the case today.”

S&P 500 performance during past Fed tightening cycles

2021 illustrated the benefit of diversification in investment portfolios. In particular, there was a wide disparity in performance across sectors of the domestic economy as well as global financial markets, as shown in the chart below. Developed markets across the world predominantly performed well, with almost all indexes generating positive double-digit returns. The story was dramatically different when one looks at emerging markets where returns were slightly negative on the year. Fixed income had an especially tough year as investors adjusted their portfolios in expectation of the pending rate increases. Almost all fixed income indexes posted negative returns for 2021.

Fourth quarter 2021 asset class performance across global markets

The combination of elevated equity multiples, uncertainty of the timing of rate hikes, and rampant inflation has left many people wondering where to invest their dollars. As Warren Buffett once said, “Interest rates basically are to the value of assets what gravity is to matter.” In other words, higher rates mean that companies who earn money today will be more attractive relative to companies that hope to earn more in the future. In these days of changing monetary policy, geopolitical strife, and supply chain difficulties, maintaining a strong investment discipline is paramount. Proper asset allocation and rebalancing when opportunities present themselves become even more important during times of uncertainty. Active management can be particularly important as these changes occur. At this time, we are focused on active equity managers who invest in sectors that benefit from rising rates as well as companies able to pass through their higher costs to consumers. In the fixed income arena, we prefer managers that are nimble in their ability to manage not only credit risk, but are also active in managing the duration of their portfolios. Please contact us to learn more about what we are doing and how we can be of service.

Inflation – What’s the Situation?

Have you noticed empty shelves at your local grocery store? If you did, you are not alone. According to Rasmussen in October, 62% of Americans have noticed shortages of basic goods. Some of those goods are sitting in masses of cargo ships backed up around our ports. The pundits are talking of inflation on the news, almost always with the word “transitory” and a reassuring tone that it would eventually go away. The message is clear; don’t believe your lying eyes. In our KnowRisk from first quarter of this year we wrote, “With demand up and supply uncertain, the potential for price increases, otherwise known as inflation, is high.” That potential has materialized, so it’s time to explore what this means and what might happen next.

To cover the basics, inflation is simply an increase in the general price level of the goods and services that Americans transact every year. Inflation is also often defined as too many dollars chasing too few goods. Almost six trillion in additional government spending created those extra dollars and the fewer products were created thanks to factory shutdowns. Since then, inflation has trended hotter than the regulators expected. As recently as June, the Federal Open Market Committee projected that 2021 would end with inflation mostly between 2.9-3.6% and those inflationary pressures would still be transitory. The target rate for inflation is 2% and the economy has run below that for more than a decade. Thus, the Federal Reserve has stated they want the economy to “run hot” for a little while.

Federal Open Market Committee PCE inflation projections

By August of 2021 however, Personal Consumption Expenditures (PCE) inflation reached 4.3%. The FOMC still predicts inflation to be transitory, but now their midpoint prediction is for PCE to end the year 5.8-5.9%. Along with their updated PCE number, Powell has also indicated that tapering of asset purchases (including mortgages) will begin at the November meeting. Hopefully Powell has telegraphed this change clearly enough, but we might see upcoming market volatility.

FRED Personal Consumption Expenditures price index

How does inflation affect the stock market? Warren Buffet recently compared inflation to a “gigantic corporate tapeworm [that] preemptively consumes its requisite daily diet of investment dollars regardless of the health of the host organism.” Inflation can increase the cost of production and the resulting products, which hurts businesses slow to adapt and consumers on fixed incomes. Colorful metaphors aside, we have to understand the underlying fundamentals if we want the best clues as to the coming effects. If this inflation is just the result of temporary cash infusions and COVID shut downs, then price levels should stabilize as these temporary disruptions wind down. According to the US Government, Americans have been incredibly busy and spent down approximately $3 out of the $4 trillion in additional savings we set aside during the lockdowns. However, other factors might be longer lasting.

U.S. personal savings drawdown from pandemic highs

A significant portion of the inflation we are feeling is due to increased costs from labor shortages and higher energy prices. Businesses have expanded hiring to give America the highest number of job openings in history (10.5 million). As we recover from the Delta variant, some of those jobs will be filled. In energy, oil stockpiles have declined to averages last seen in 2014, and global inventories continue to draw. Goldman is projecting oil to hit $90 by year end, and the number of rigs drilling in the US is still below average for the previous decade.

U.S. oil rig count versus prior-decade average

The key question going forward is “Can we maintain or exceed this level of production in the face of rising prices, including the price of oil?” With more people returning to work, businesses adapting to market conditions, and price levels stable, signs are optimistic. No economy is without risk. A further dramatic increase in energy cost, or new regulations increasing the cost of hiring or manufacturing would be a negative shock to the economy. In the 1970’s the US experienced a combination of stagnation and inflation, called stagflation. Central banks have changed dramatically since then, adding far more tools to their repertoire. Equitas examined both scenarios (high growth/high inflation, low growth/high inflation) on a quarter-by-quarter basis. The chart below displays the results. A booming economy acts like a rising tide lifting all boats. When the economy slows, there’s almost nowhere to hide.

Asset class performance under high-growth versus low-growth inflationary scenarios

New technology pundits like Cathie Wood tell a different story about inflation, believing that new technological innovations will be deflationary. Industrial productivity can be enhanced eliminating the need to raise product prices. Wage demands are the largest component of inflation and automation means fewer workers are needed taking the pressure off rising wage demands.

Some combination of these inflationary and deflationary economic forces will become evident next year. Few of today’s investors were active in the super inflationary days of the 1970s. No one has seen the government spending we see today. No one knows the effect of all the technological changes that are coming at us in exponential speed. We find it best to be prepared for any combination.

How High Is Your EQ?

When I started in the investment business in 1980 the Dow was at 1,000. Now 40 years later the Dow is at 35,000. So if you had invested $100,000 in 1980 you would have $3.5 million today. The most amazing part is that this is only a 9.1% return. This is approximately the same rate of return the market has averaged for the last 100 years. Now this does include several hair-raising downturns where the index dropped 20%-50%. However, all you had to do was not panic and jump out at the wrong time and you made your $3.5 M. The broad-based economy is doing all the work. Investors get to come along for the ride.

So why are all long-term investors not rich? Most cannot handle the wild ride. To reverse an old saying, they snatch defeat from the jaws of victory. Too many investors sell out at the bottom because of fear, and buy in at the top because of elation. It is human nature; however, with practice the logical mind can learn to become stronger than the emotional heart.

Warren Buffet has done it. As one of the best active managers in history, Buffett says investors should do all the investment work, or none of it. No middle ground. Either way, the investor must be able to emotionally handle the bumps and bruises of the wild ride in the market. Buffett believes the market has been going up for 100 years and will continue to go up for another 100 years. The key is not a high IQ, an Intelligence Quotient, it is an emotional IQ, or an Emotional Quotient. Let’s coin that term an “EQ”.

“Compound interest is the eighth wonder of the world. He who understands it, earns it. He who doesn’t, pays it.”
Albert Einstein

If we extrapolate the same 9.1% return, the compounding affect has the Dow reaching the 100,000 mark in only 13 more years. Is this a prediction? No, Equitas does not make predictions. It is the recognition of an economic inevitability that will happen sooner or later if we are all still here.

Will this happen in a straight line? Of course not. It never does. Will there be some bumps in the road? Of course. There always are. Will many investors be shaken out by their low EQ? Unfortunately, yes. The prerequisite is a belief and confidence that the economy will continue to grow, or even accelerate, into the future. Few investors have an EQ that can handle the full unbridled, unhedged, stock market volatility. The secret is adopting an investment strategy that is comfortable for you personally. A strategy where your wheels will not fall off because of the market volatility. A strategy where you can make money and still sleep at night.

Economic Update

It’s been a while since we issued an update on fundamentals, so we thought we’d roll up our sleeves and dig into the numbers for this quarter’s KnowRisk Report. The better we understand the exact mechanisms at play, the better we will understand the unfolding economy over the near term future.

As we all know, COVID19 and the ensuing government/health shut downs had a major negative impact on the economy. In economics terms, factory shutdowns lead to lower supply of many products, while at the same time, demand patterns shifted such as the shutdown of large portions of the travel and restaurant sectors. The net effect ended as a decrease to US GDP by $500 billion or 2.3% for the year which would have been considerably lower without government intervention. For reference, GDP growth was -2.75% in 2008. To avoid the risk of igniting a negative feedback cycle, the government took three major actions: Congress funded $5,335 billion of business and personal income (including the recent American Rescue Plan), the Federal Reserve financed $2,700 billion in purchases in the government and corporate bond market, and the fed lowered interest rates from 1.5% to zero.

So where are we now?

These actions were successful in the following areas: equity prices generally rebounded and continued rising, corporations raised a large amount of debt while debt to equity levels dropped (due to equity prices soaring higher than debt levels), and American households managed to stock away $1,600 billion of savings. Some government interventions are still in place. For example, the Fed continues to purchase an additional $120 billion worth of treasuries and mortgages a month. The latest round of stimulus is still making its way through the economy. Finally, segments of the economy remain restricted both by government and by slowly returning demand.

Normalization will have some predictable effects on the future economy. With the assumption of a certain amount of mean reversion, we can uncover some clues to the future. Continued vaccinations and natural immunities are leading to continued economic normalization. As government payments cease and businesses increase capacity, unemployment will continue to decrease. The American rescue plan will continue to impact spending, and Americans will spend down a portion of their excess savings. These three factors are all working in harmony to increase the “demand” side of the equation. Keep in mind, the size of consumer savings is currently 3x the size of the gap in GDP last year. On the “supply” side, while we are hopeful that the worst of the COVID shutdowns are over, we are worried that shutdowns due to shortages are on the increase. We see this currently with car factories shutdown over missing computer chips, which are predicted to last at least a year. With demand up and supply uncertain, the potential for price increases, otherwise known as inflation, is high.

The recovery has also been very uneven. Oxford Economics estimates that the top two income quintiles in the U.S. own all of the $1.6 trillion of extra savings. In terms of sectors of the economy, the US Real Estate index “FTSE NAREIT” has only just returned to levels from February 2020 as of April 2021, while the NASDAQ Tech index has gained over 80% in the same period. The price of lumber has increased even more dramatically. Government bonds, one of the most stable asset classes, lost -4% for the past year ending March 31 2021, with long duration debt hit worse down -16% for the same period. Worryingly, margin debt has increased dramatically which can be sign of speculation driving the market. Low interest rates contribute to speculation, as uncertain future payments are worth more in the present than they would be under higher interest rates.

Margin debt levels signaling market speculation

Duration movement in bonds was particularly dramatic in the first quarter driving almost all of the loss. Despite the Fed again promising lower for longer, the market has decided to disagree by betting on rates moving higher more quickly. With rates this low, we are reminded of several KnowRisk reports we wrote in 2012 while rates were at this level, including one with the appropriate title “Return-Free Risk.” It’s available on our website and worth a reread. The Federal Reserve does have at least two separate tools to manage this. Their next step will be ending their open market purchases. When Ben Bernanke, then Federal Reserve Chair, mentioned ending these purchases in 2013 after the Financial Crisis, interest rates briefly spiked. After that, the Fed can also cool the economy (and presumably inflation) by raising interest rates. However, we must remember that they have promised not to do so for a while. Regardless of whether rate increases happen sooner or later, the change will hurt long duration bonds and equities anticipating future payouts, while shorter duration bonds and companies earning more today with slower growth will look more attractive. According to Jamie Dimon, CEO of JPMorgan/Chase Bank: “I have little doubt that with excess savings, new stimulus savings, huge deficit spending, more QE, a new potential infrastructure bill, a successful vaccine and euphoria around the end of the pandemic, the U.S. economy will likely boom. This boom could easily run into 2023 because all the spending could extend well into 2023. The permanent effect of this boom will be fully known only when we see the quality, effectiveness and sustainability of the infrastructure and other government investments.” This leaves the question of what happens after the effect of the economic stimulus “sugar high” wears off.

Innovation Disrupt… or Be Disrupted

Around 5,000 years ago (2.5 times as far back as Rome), humanity first domesticated the horse. This new invention impacted economics, travel, and military to such a degree that population trends across three continents forever changed. The domestication of the horse was a disruptive technology that completely replaced the earlier way of doing things. The horse then remained dominant throughout human history including the founding of the United States, lasting until Henry Ford revolutionized the automobile industry in 1908 with the Model T. At that point, the previous disruptor became the disrupted and the cycle repeated. At Equitas, we never say “We’ve always done it this way.” That is one of the most dangerous sentences, and we are always keeping watch for newer and better ways of doing things. At present, we are in the midst of similar disruptive moments across several industries.

Transportation

Times are always changing, and the rate of change in several industries has never been faster than the present. Speaking of the horse, the personal transportation industry is an industry currently in the crosshairs of a disruptive moment. ARK Investment Management, an investment research firm focused solely on innovation and disruption, estimates that $8 trillion of US public equity value is at risk.

The biggest chunk of the value at risk lies within the energy industry, as some researchers predict a 40% decline in oil demand by 2030. If battery system cost declines continue at the current rate, electric vehicles could be cheaper than their gas guzzling counterparts in the next five years. Concurrently, autonomous driving systems powered by AI could boost utilizations while also lowering costs. ARK estimates that the cost of self-driving taxis could fall below traditional car ownership landing at a cost of just $0.25/mile.

Projected cost per mile of autonomous taxis versus traditional car ownership

With the cost of taxi service dropping dramatically, fewer buyers will be willing to pony up the purchase price (including financing) which will impact dealerships. These robot drivers never take their “eyes” off the road either, so they’re typically safer drivers (estimated 80% fewer accidents) which impacts the insurance industry. The key to this industry is the AI driver, which improves according the amount of training data that it has access to. This barrier has the potential to lead to a winner-take-most industry, leading to consolidation. These large-scale changes are coming likely sooner than most think, and some argue is not being accurately reflected by current market valuations. Autonomous driving has been tested for years now in Phoenix. The biggest complaint by the human drivers is that the cars stop for yellow lights! Autonomous taxis mean sprawling parking lots will not be needed and can become beautiful parks.

The freight rail industry as a sub-sector of transportation is similarly under threat of disruption. Over the next decade, experts predict the cost of trucking to fall from $0.12 per ton-mile to 3 cents, falling below the cost of rail which previously had been gaining market share. The freight rail industry accounts for 12.5% of the S&P 500 today and represents over $750 billion in total public enterprise value.

Projected cost of trucking versus rail freight

Television

The traditional TV market is currently being disrupted by on demand entertainment like Netflix. Network TV’s capitalization is estimated at $300B for subscriptions and another $135B in advertising revenue totaling $442B in market value at risk. A Netflix subscriber enjoys a cost advantage per hour of entertainment of 1/3rd that of traditional TV and that savings continues to lead consumers to cut the cord. The key disruptive moment comes when adoption begins to hit mass market.

Traditional TV market value at risk from streaming disruption

Retail to E-Commerce

Brick and Mortar Retail is losing to online sales in another disruptive market. US e-commerce gained from 11.3% of retail sales at the end of 2019 to 16.1% by the second quarter of 2020, the largest quarterly jump in history. The retail market plus associated real estate loans totals over $6 trillion at risk.

Brick and mortar retail sales versus e-commerce growth

Brick and Mortar Banks with $260 billion in fixed assets have few options vs mobile banking companies like Venmo or Cash App who increased their monthly active users by 32 and 30 million respectively in the last four years. Globally, China has already surpassed the USA in e-commerce and e-cash payment usage.

Healthcare

The global healthcare market, over $8.5T, is at risk on a few fronts. Brick and mortal services are under threat from telemedicine, which allows patients to skip a trip to the doctor’s office and receive a clinical diagnosis via mobile phone or video chat. According to Edward Yoon, health sector leader for Fidelity Investments, “While many of these new health care delivery models are early in their rollout, as they scale nationally it will fundamentally realign the incentives for providers and payers. Importantly, this could create a meaningfully improved consumer experience and be done at lower costs.” Prior to the pandemic, Business Wire estimated telemedicine at a 19% annualized growth rate through 2022 which has increased.

Gene editing had its first mass market use in COVID vaccine. CRISPR Therapeutics alone grew their total revenue from $3 million in 2018 to over $289 million in 2019.

Growth of telemedicine adoption

Technology

Technology upgrade cycles are showing signs of mini disruptive patterns. Since the 1980’s a new generation of wireless data disseminates every 10 years. In 2019, the world started the upgrade to 5G, which allows speeds up to 10 gigabits per second. The technology is expected to usher in the Internet of Things with widespread connectivity between devices. Verizon alone is spending $17 billion a year to accelerate their transition to 5G. That much data processing will require cloud computing. The global cloud computing market size was valued at USD 266.0 billion in 2019 and is expected to expand at a Compound Annual Growth Rate (CAGR) of 14.9% from 2020 to 2027.

US cloud computing market size and projected growth

Robotics

The automation trend is big, broad, and fast-growing. In the field of factory automation alone, the total addressable market globally was about $160 billion in 2018. That market is expected to grow at a compound annual growth rate (CAGR) through the next 5 to 10 years.

Growth of the factory automation and robotics market

Conclusion

Innovation brings on disruptive technologies and disruptive investments can change the world quickly, which means they come with some volatility. The best managers find great companies in industries that are already growing rapidly and will continue growing far into the foreseeable future. This type of growth typically does not come in a straight line. Cathie Wood in a recent video interview told investors that she expects a correction and warns investors to “take a bit of money off the table and keep some powder dry.” Innovation may have several risks, but the biggest risk may be “we’ve always done it this way” never changing and falling behind.

The exponential growth of the current mega-trend may turn out to dwarf the innovation of the last big technological innovation period which was the industrial revolution. At that time the new fanged innovations were electricity, telephones, light bulbs, and the internal combustion engine. The incandescent light bulb is being disrupted by LED lighting sources. Land line telephones have been disrupted by cellular. The internal combustion engine is beginning to be disrupted by more efficient electric engines.

This technological innovation revolution looks to be the driving force for years to come. We find it unwise to bet against mega-trends. The technological revolution benefits significantly since it gets to stand on the shoulders of the industrial revolution and take innovation to new heights.

Why Is the Market So Strong & Economy So Weak?

The continuing strength of the stock market, even as the coronavirus pandemic batters the U.S. economy, has baffled many investors. The Dow Jones Industrial Index fell some 35% in 20 trading days the first three weeks of March as COVID-19 began spreading rapidly globally, but it has since gained nearly 60% to levels above 28,650. At the same time, the Commerce Department reported the U.S. economy shrank 31.7% in the April-June quarter. Part of our job at Equitas is to research many areas of the market and the economy, analyze the current environment, and to search for the investment opportunities. While there are numerous views and theories, in this KnowRisk Report we explore and expand on why the stock market is so strong, while the economy is so weak. We start with Wharton finance professor Itay Goldstein who has boiled it down into two reasons: the long-term prospective of the stock market, and the unprecedented cash infusion of the Federal Reserve.

The First Reason

Goldstein says at all points in time “the stock market is meant to be forward-looking.” Indeed stocks have risen during seven of the past 12 recessions going back to World War II. “In general, the stock market is a bit different from the economy, in the sense that what you see right now in the economy is what is going on right now” such as production, employment and so forth, he noted. Even in “normal times,” stock prices and economic output would not move in tandem, according to Goldstein. In fact, we may have situations “where the stock prices may predict something that is going to be different from what we see right now.” The S&P 500, for instance, is driven more by manufacturing, while U.S. gross domestic product, the broadest measure of goods and services produced by the economy, is propelled by the services sector. The latter took a bigger hit due to social-distancing measures from the lockdowns, as consumer spending accounts for more than two-thirds of U.S. economic activity. Stocks of tech companies that have enabled employees to smoothly transition to working from home have thrived in the market environment. Case in point are strong earnings reports from Facebook, Apple, Amazon, and Alphabet in late July. The good news extends beyond those companies, with about 40% of the S&P 500 classified as technology, digital media, or e-commerce. The different between the classic styles of Growth and Value stocks may be the difference between the innovators and the interrupted.

The Second Reason

The Federal Reserve has “put a lot of money into the market, and that certainly helps keep prices up, maybe above what we would expect without this intervention,” said Goldstein. The fear of returning to the hyperinflation of the 1970 appears to have reversed itself and now the Fed is worried about not having enough inflation. Federal Reserve Chairman Jerome Powell spoke of a shift in the Fed’s inflation goals, “signaling that it wanted inflation to rise modestly above its 2% target,” according to a Wall Street Journal report. That essentially “ushers in a longer era of lower rates,” the Journal noted. “Inflation that is persistently too low can pose serious risks to the economy,” Powell noted. “Inflation that runs below its desired level can lead to an unwelcome fall in longer-term inflation expectations, which, in turn, can pull actual inflation even lower, resulting in an adverse cycle of ever-lower inflation and inflation expectations.” The Fed was clearly worried about the prospect of the U.S. facing a sustained period of low inflation, a trap that ensnared Japan and Europe, the Journal article reported. Historically, money-supply growth and stock prices have moved in tandem.

Stocks vs Bonds

While stocks appear to be expensive, they actually look cheap when you compare them with US Treasury bonds, with the 10-year yielding about 0.6%. When discounting future profits back at such low interest rates, stock valuations get a significant boost. In early August while large-cap tech stocks were trading at a price-to-earnings multiple of 20x to 30x, that looks cheap relative to the 10-year US Treasury, trading at 180x, and corporate bonds, trading at 40x.

Vision

Historically, money managers are looking ahead 6 to 9 months. However, currently the vision may be looking a lot further out. Investors value companies over the long term using fundamentals like corporate profits and cash flows. This perspective involves more than just looking ahead six or nine months and anticipating an economic recovery. Of course, no one knows the extent and length of this economic downturn, but let’s assume that corporate profits and cash flows will be 50% lower than they otherwise would have been for the next two years, and then return to levels that are permanently 5% lower than otherwise. Discounting the impact of these lower profits and cash flows suggests a decline in the present value of the stock market of less than 10%. Naturally more severe assumption would have more impact while less dire assumptions would lead to a smaller dip in valuations. The following graph shows how this works.

The top line of the graph assumes COVID-19 never happened and cash flows increase 4% each year (2019 is scaled at 100). The 4% growth rate represents a conservative estimate of 2% real growth (a conservative estimate based on history) and 2% inflation from the Fed’s expressed target. The light gray area shows the how our assumptions of lost cash flows because of COVID-19. As you can see, the lost cash flows are small relative to the total potential cash flows.

The Pandemic Will Have an End Date

One key reason stocks could be poised for more gains in the coming months is that investors are betting that the pandemic will eventually end with a vaccine or herd immunity. Fundstrat’s Tom Lee said in July that it was likely that at least one of the 133 coronavirus vaccine candidates would be successful, which could lead stocks to significantly new highs. “There’s still that positive skew … by December I think we’re going to see progress,” Lee added. According to research firm CFRA, which analyzed data going back to 1932, the S&P 500 has averaged a 46% return in the 12 months following the start of a new bull market. Naturally any setback in the timeline for developing a vaccine could challenge the stock market’s rebound.

Not All Roses

Not all analysts are positive. The Los Angeles Times recently had these “encouraging” comments: “None of this means stocks will continue to rise forever. In fact, the longer stocks are propped up by factors unrelated to the actual health of companies, the bigger an eventual downturn will be. That includes the possibility of a major crash. Low rates and Fed purchase of corporate bonds keep alive weak companies that will eventually fail. Passive investing can sink a market as well as raise it if people begin to redeem their funds. Investors can get burned trading artificially inflated stocks, as they did during the dot-com bubble. No one knows how high the stock market will go before it inevitably cycles downward, nor how hard and fast the fall will be. In the face of such uncertainty, sound investment advice is hard to come by.”

The goal at Equitas is to provide that sound investment advice that is so needed.

Adapting to Change

My grandmother was born in 1898 when Oklahoma was still an Indian territory. The amount of innovative inventions and new technology developed in her lifetime were amazing. Statehood, automobile, telephone, phonograph, electric lights, indoor plumbing, airplanes, space travel, and more. I remember how amazed she was to discover the microwave oven! She was an immediate adopter and marveled at how quickly she could cook, compared to the old technology oven. I have always found it helpful to be open-minded and an early adopter of innovation. There is a competitive advantage to this in my opinion. Attending the Singularity University innovation conferences builds excitement and intrigue about the mind-blowing technological changes underway.

However, for many people, change is uncomfortable. They have inertia like resistance to the innovations. After all, it is called disruptive technology for a reason. The hardest part about change, according to psychologists, is not embracing the new innovation; it is in giving up the old. Still others see change as opportunity. This is not a new phenomenon and has probably been a human character trait since the invention of the wheel. With the rate of change accelerating exponentially today, the uncomfortable disruption, as well as the embedded opportunity, will likely follow with the same speed.

Venture capitalist Morgan Housel with the Collaborative Fund has written about change we have already experienced in the last century, and our collective response to that change. Wilbur and Orville Wright conquered flight on December 17th, 1903. In 1900 it took four days to travel from New York to Los Angeles by train. By the 1930s it could be done in 17 hours by air. By 1950, six hours. But days, months, even years after the Wright’s first flight, hardly anyone noticed.

Through research done at the Library of Congress, the front page of The New York Times the day after the first flight said not a word about the Wrights. Two days after: again, nothing. Three days later, when the Wrights were on their fourth flight, one of which lasted nearly a minute: nothing. This goes on — four days, five days, six days, six weeks, six months — no mention of the men who conquered the sky for the first time in human history. It was not until May, 1908 — nearly four and a half years after the Wright’s first flight — that experienced reporters were sent to observe what they were doing and the world at last woke up to the fact that human flight had been successfully accomplished. Things that are instantly adored are usually just slight variations over existing products. We love them because they’re familiar. The most innovative products — the ones that truly change the world — are almost never understood at first, even by really smart people. It leads to the expression, if you are 5 years ahead of your time you are considered a genius; if you are 10 years ahead of your time you are considered a nut.

It happened with the telephone. Alexander Graham Bell tried to sell his invention to Western Union, which quickly replied: “This ‘telephone’ has too many shortcomings to be seriously considered as a practical form of communication. The device is inherently of no value to us. What use could this company make of an electrical toy?”

It happened with the car. Twenty years before Henry Ford convinced the world he was onto something, Congress published a memo, warning: “Horseless carriages propelled by gasoline might attain speeds of 14 or even 20 miles per hour. The menace to our people of vehicles of this type hurtling through our streets and along our roads and poisoning the atmosphere would call for prompt legislative action. The cost of producing gasoline is far beyond the financial capacity of private industry… In addition, the development of this new power may displace the use of horses, which would wreck our agriculture.”

It happened with the index fund — one of the most important financial innovation of the last half-century. John Bogle launched the first index fund in 1975. No one paid much attention to for next two decades. It started to gain popularity, an inch at a time, in the 1990s. Then, three decades after inception, the idea spread like wildfire.

Internet. It’s happening today in many areas, as human behavior has not changed. Paul Krugman, the Nobel Prize Winner and Op-Ed Columnist for the New York Times wrote in 1998, “The growth of the Internet will slow drastically, as the flaw in ‘Metcalfe’s law’ becomes apparent: most people have nothing to say to each other! By 2005, it will become clear that the Internet’s impact on the economy has been no greater than the fax machine’s.”

Photovoltaics were discovered in 1876. They were commercially available by the 1950s, and Jimmy Carter put solar panels on the White House in the 1970s. But they didn’t take off — really take off — until the late 2000s.

Artificial Intelligence is taking the innovations of the technological revolution into atmospheric heights at warp speed. The rate of change is actually accelerating. It may be that the generation today experiences even more innovation than my grandmother experienced 100 years ago. This will be uncomfortable and unnerving for some, and bold new opportunities for others.

In conclusion, big innovation breakthroughs typically follow a seven-step path:

  • First, no one’s heard of you.
  • Then they’ve heard of you but think you’re nuts.
  • Then they understand your product, but think it has no opportunity.
  • Then they view your product as a toy.
  • Then they see it as an amazing toy.
  • Then they start using it.
  • Then they couldn’t imagine life without it.

This process rarely takes less than several years and can take decades.

From the investing standpoint, some final points arise from this. Stanford professor Paul Saffo put it this way: it takes 30 years for a new idea to seep into the culture. Technology does not drive change. It is our collective response to the options and opportunities presented by technology that drives change.

Economist John Keynes said, “Successful investing is anticipating the anticipations of others,” and, “The difficulty lies not so much in developing new ideas as in escaping from old ones.”

When innovation is measured generationally, investment results shouldn’t be measured quarterly. History is the true story of how long, messy, and chaotic change can be. The stock market is the hilarious story of millions of people expecting current companies to perform quickly, orderly, and cleanly as expected. The gap between reality and expectations explains untold frustration and poor investment decision timing.

Coronavirus (COVID-19)

The coronavirus is the big news of 2020. Originally thought an airborne virus which can be contained by masks, corona is now believed to be both airborne and a fecal-oral virus where masks are ineffective and the keys to prevention are water sanitation and hand washing hygiene. This is practiced more in the developed countries than the developing countries. The virus has a longer incubation period than the typical 14 days and has been diagnosed after 27 days. It is contagious outside the body for longer than the typical 48 hours. According to the February 26 World Health Organization report, roughly 81,109 people worldwide have been diagnosed with the coronavirus, with the vast majority of cases located in mainland China. Only 2,918 cases tallied outside China.

Markets historically (or hysterically) over react to news on both the upside and the downside. This may be the case here too. In the last 4 months the regular flu season has infected 26 million and killed 25,000 in the US according to the Washington Post. Reading the Apple corporate reports, the supply chain disruption is causing delays affecting quarterly earnings, but is not destroying the world economy. The global markets are reacting to this virus as the next bubonic plague which should lead to buying opportunities. For the crisis to widen, there would have to be person to person transmission leading to deaths in the highly sanitized developed countries. This would be a more serious threat and could deepen the panic. However, here is a report and graph from one of our investment managers in China:

China equities retreated after Mid-January, triggered by the outbreak of a novel coronavirus in China. However, the market has rebounded since Feb 4th, the second trading day after A-shares started trading after the long holiday of the Chinese New Year. For us, the virus, which is a serious threat to health, is a short-term risk for China equities, and the most challenging time appears behind. The initial cases occurred in Wuhan, Hubei Province, China, in December 2019 and got worse after that. With the government’s austere measures restricting Chinese people from going outdoor and traveling, it appears that the number of diagnosed patients peaked in Mid-February and trended down significantly since then.

The real risk in the stock market may be something else. As we have written in previous KnowRisk Reports, the markets are over 50% passive now with another 20-30% using automated computer, factor, and momentum trading systems. Fundamental analysis is a smaller part of today’s market. This lowers daily liquidity and leads to higher volatility. While these factors exist, the effect on the stock market is permanent.

KnowRisk® Coronavirus Update

These are no doubt the “interesting times” from the old Chinese proverb. As discussed before, bull markets die from trigger points and not old age, and we experienced both in just 20 days. On February 20th the S&P 500 was 3,400 and on March 23rd it was 2,200. That was a 35% drop in 20 trading days. We entered a war with 3 fronts; the Covid-19 disease, the energy price collapse, and a contraction of all consumer-based economies. Although all 3 are scary, the cure may be worse than the disease.

Double digit down years in the stock market are rare. In the last 100 years, the Dow Jones market index was up 70 years and down 30. Only 16 years out of the last 100 was the market down in double digits and it was down greater than 20% in only 6. Declines both expose risk and reveal opportunities. I will always remember 9/11/01 when 3 terrorist flown airplanes crashed into buildings. A fear of flying gripped the country. However, the period after the crashes was one of the safest times to fly. The risky time was before the crashes. Remember, the lower the market goes, the lower the risk goes, and higher the opportunity goes.

For some examples, the virus is on the decline in China and South Korea and 98% of all listed Chinese companies are back in production. More than 75% of the S&P 500 companies have dividend yields higher than the US 10-year treasury yield. State and local pension plans have gone from an average of 60% equity to 40% in equity in the last 20 years creating pent up demand.

One discussion that always seems to arise is “It is different this time.” This fear of the unknown quells many investors into inactivity from the mysterious “difference.” Actually, it is always a little bit different every time, but the difference never negates the fundamental laws of the physics of investing.

The pundits talk now about the timing and shape of the recovery. V shaped, U shaped, L shaped. In 1987 we had a quick V shaped recovery. In 2008 we had a slow V shaped recovery. The golden thread throughout all of this is that all have a recovery. The question is not how to time it, it is how to position for it.

The onset and spread of the coronavirus is expected to cause global GDP growth rates to be revised downward by economists. The International Monetary Fund (IMF) initially set its forecast for global growth in 2020 at 3.2%, up from 2.9% last year. The estimated cutbacks in China alone — where growth had been forecast at 6% for the year, but may come in closer to 2% — could reduce that 3.2% rate down toward 2.5%. After adding in the facts that Japan’s economy contracted 6% in the latest quarter and that Germany has been flirting with recession for the past year, it becomes clear that 2020 is likely to be the slowest year for growth since the financial crisis years of 2007-2009. The damage to the consumer-based economies and worker unemployment may be one of the worst ever. To spur growth, look for central banks around the globe to cut rates, and for governments to consider fiscal stimulus programs. The US government already launched a several trillion-dollar stimulus campaign.

Morningstar has 3 widely differing estimates for GDP entitled Base case, Bull case, and Bear case. All of these seem optimistic.

The process of ‘containment’ and ‘slowing the spread’ that is phasing in country by country will create major disruption in itself, irrespective of the seriousness of the virus spread alone. The widespread global panic of COVID-19 is unlike previous crisis and the traditional ‘crisis response’ approaches will not be sufficient. The US economy is approximately 70% consumer driven and the shutdown of the consumer could lead to substantial revenue disruption and a potential liquidity crisis. US automobile manufacturers have closed their factories, now accompanied by cinemas, restaurants, bars, malls, theaters, and even churches.

When put into context with 7 other recent pandemics, the picture does not look quite so dark. Wuhan, China (where the virus was first detected in December) reported just one new case for the second day in a row. The situation had improved enough that China sent medical supplies to hard hit France returning a favor by the French weeks ago. Death totals by country as of April 15th are: China 3,342 (if you believe it); Italy 21,645; Iran 4,777; France 17,167; UK 12,868; and the U.S. 32,588. This does not seem as severe a problem when you consider in the U.S. alone, the flu has caused an estimated 36 million illnesses, 370,000 hospitalization and 22,000 deaths this season, according to the Centers for Disease Control and Prevention (CDC). On average there are 291,000 to 646,000 deaths worldwide because of the regular flu, and 12,000 to 61,000 deaths in the U.S. every year, according to Johns Hopkins University.

If the higher probability Base case evolves, this could be a V shaped decline and rebound. The Morningstar estimates still show lower but positive GDP which means it is technically not a recession (defined as two consecutive down quarters). This could create one of the best stock buying opportunities since 1987. The key may not lie within the coronavirus as much as it is the people’s reaction to the coronavirus.

The real risk in the stock market may be something else. As we have written in previous KnowRisk Reports, the markets are over 50% passive now with another 20-30% using automated computer, factor, and momentum trading systems.

Fundamental analysis is a smaller part of today’s market. This lowers daily liquidity and leads to higher volatility. While these factors exist, the effect on the stock market is permanent.

China’s GDP has been shifting gears for years as the country shifts from a manufacturing/export economy to a consumer driven economy like much of the developed countries. Here is the Morningstar estimate of the effect on their estimated GDP for China. This shows a significant and acute effect short term, but long term largely unaffected.

A Lesson from Another Disaster

I learned a valuable lesson from Hurricane Katrina. That disaster was contained within the Gulf Coast. There was little affect outside that region, but severe destruction within. I can remember the stress and strain of moving the business to Baton Rouge, finding office space and housing for a dozen families, moving my own family to the west coast, putting the kids in school there, commuting back and forth on the weekends, working some 20 hour days, and wondering how I was ever going to get it all back together.

In retrospect, I could have thought a little more out of my own personal box. I could have been out on a boat with our clients the Harbor Police taking people off of roofs and pulling people out of attics.

This coronavirus pandemic is a worldwide disaster. There is no place to escape, except the safe confines of your own home. Having lived through stress like this before, I feel calmer this time. I can see through the virus to the longer-term effects of the panic which is locking up the consumer driven economy. At times like this it is very easy to take the wrong steps out of fear. This time there will be no people to help off roofs, but there may be some that need to be helped down off a financial ledge.

A Decade in Review

At New Years’ Eve in 2009, the mood was somber yet cautiously optimistic as the S&P500 had rebounded halfway from its bottom in the Great Recession and “Boom Boom Pow” by the Black Eyed Peas topped the pop music charts. Twitter just turned two years old, smart phones were beginning their growth, and Barack Obama served half of his first term as President of the United States. Warren Buffet was also two years deep into his winning bet that the S&P 500 would outperform a basket a hedge funds for the next decade. In this quarter’s KnowRisk Report, we’ll take a deeper look at some of the winners (and losers) of the past decade.

The chart above shows the performance of eleven different index funds over the past ten years. Unsurprising to many, the Russell 1000 Growth Index has claimed the lead, returning 312% for the decade, followed closely by other US Equity indexes (including Value, Small/Mid Cap, and Real Estate specific indexes). International Equities lead the middle cohort returning 79%, with Emerging Markets earning 49%, the US Aggregate Bond Index returning 44% (with a much smoother ride to the finish), and diversified Fund of Funds returning 31%. The losers of the decade include Commodities down -43% with Crude Oil alone down -25%. The most abrupt movement in the chart is with Crude Oil at the end of 2014, showing the big impact US shale has had on the asset class.

On a year by year basis, the twenty-teens were largely good to risk assets with most years delivering positive returns. Commodities and the Emerging Market Index (which includes many countries with commodity-based economies) had the most volatile time with 5 positive and 5 negative years.

Year-by-year returns across asset classes for the decade

As for Warren Buffet, he won easily as at the end, the S&P 500 index fund annualized 7% while the diverse basket of hedge funds his opponent selected annualized a measly 2%. Buffett attributed his victory to the low costs of active funds. His opponent, Ted Seides of Protégé, blamed the diversification of hedge funds, pointing out that the MSCI All Country World Index has performed almost exactly in line with the hedge funds in the bet. “It was global diversification that hurt hedge fund returns more than fees,” Seides concludes.

A look-back to previous decades also illustrates some interesting trends. Many of the equity indexes saw big disruptions in the decade of the early 2000’s as the dot-com bubble burst, returning small gains or even small losses. In this category Growth and Value have trended back and forth in terms of outperforming each other each decade. In Fixed Income, the Aggregate Bond Index displayed decreasing returns in each successive decade corresponding to the steady decline in interest rates since Volker’s aggressive moves to calm inflation in the late 1970’s. The most recent decade proved to be uncharacteristically bad for commodities.

Asset class returns by decade

Beyond asset class performance in isolation, an examination of fundamental factors can help shed light on the current state of the market. The chart below displays the forward Price Earnings Ratio of the S&P 500, which compares stock prices to the projected earnings of the underlying companies. Historically, the Forward P/E ratio has trended between 13x and 19x. The market started the decade cautiously at the lower side of this range, and has ended with optimism nearing the top side of the range.

S&P 500 forward price-to-earnings ratio history

The above graph shows that on a forward P/E basis, stocks are approximately in line with their 25-year average through 2018 — a period that includes at least one bubble and two crashes. Add in the strong 2019 from this graph, and the forward P/E is slightly above the average at 18.4.

S&P 500 forward P/E versus 25-year average

This is far from the frothy peak when the dot com bubble hit 27, and way above when the great recession trough hit 10. Although the trough happened percipitously, it took years to build up to dot com peak. The last 5 years of the 1990s yielded a 20%+ return each year for the S&P. How many investers stayed in through that run? Of the investors who sold out, how many bought back in at the trough of 2002? More often, it is common for investors to enter during the euphoric times like the late 1990s, and sell out during the fearful times of the early 2000s.

One of the hardest parts of the investment business is knowing when to hold ’em, and knowing when to fold ’em. Professional money managers struggle with this also. The growing trend of passive investing is now aproximately 50% of the market. Passive investors believe the active investors cannot beat the market. The statistics say Yes and No: there is a cyclicality to the market which creates a cyclicality to the these two styles of investing.

This Morningstar graph shows this cycle very clearly. At some points the market is in the 80th percentile of the US Equity Funds universe, and at other points the index is in the 20th percentile. The 80th percentile means that 80% of the active funds beat the index. The 20th percentile means that only 20% of the active funds beat the index.

Cyclicality of active versus passive fund performance percentile rankings

Historically, active and passive investment approaches have cycled through periods in and out of favor. Although in this current market cycle, the benefits of passive may seem obvious, in the past 62 years, the passive investing outperformed the active investing about half of the time. When the market is rising and volatility is low, passive investing tends to outperform active investing. Conversely, when volatility is high, active investing shows its value with risk management through stock picking, trading, and cash management.

Pick Your Pivot Point

Growth Has the Momentum

For this KnowRisk Report, we are undertaking some research on the pivot points between the Growth and Value investment styles that has been swinging back and forth like a pendulum for decades. When will it swing back to Value? No one knows. However, if the game is to buy low and sell high, we do know how to tell what is low.

Since the end of 2016 through third quarter 2019, the Russell 1000 Growth Index has grown explosively by 58.12%, while the Russell 1000 Value Index has limped along returning a modest +22.8%. This is one of the longest sustained “growth” cycles since the Dot-Com Bubble, although that period saw an even bigger performance differential between growth and value.

The portfolio managers at the value style company, Lyrical Asset Management, have identified three common factors to the beginning of every value upcycle/ending of every growth cycle, which they describe as being similar to an earthquake. T.S. Eliot wrote: “This is the way the world ends, not with a bang but with a whimper.” Value cycles, however, are the opposite, typically ending the growth cycle with a bang. Growth cycles typically last an average of 20 months, and it is darkest for value before the dawn. The chart below shows the current cycle, which has several characteristics in common with past cycles including the financial crisis in 2008, and the tech bubble in 2000. The early 90’s, 80’s, and 70’s saw similar patterns. The yellow line in the graph signifies the pivot point.

Historical growth-to-value pivot points across market cycles

For the last decade, the underlying companies in this manager’s portfolio have grown their earnings an average of 7.6% a year. That same stat for the companies in the S&P 500 is 5.9%. Surprisingly, even with the higher earnings growth rate, their value stock portfolio Price-to-Earnings (P/E) Ratio has compressed to 8.9 while the S&P 500 PE Ratio is 17.1. On a price to earning basis, that is almost a 50% off sale. Value stocks are cheap. Will they remain cheap?

The one thing in common in all of the previously examined scenarios is that they each had the successful conclusion of a “reversion to the mean.” What if this time is different?

Price-to-earnings ratio comparison between value portfolio and the S&P 500

“This Time It’s Different” — Famous Last Words

Previous growth cycles have included dramatic P/E multiple expansion by some of the biggest names in the index. That is, the price and weight of these companies increased faster than their underlying earnings. Recently, FAANG stocks have grown market cap from 1% to 10% of US equity market, but have grown profits from 1% to 12% of US equity market. Since profits have grown faster than valuation, over-valuation concerns are muted. The “top heavy” nature of the stock market has also changed. The percentage of the total market represented by the five largest companies, as high as +40% in the past, is at the lower end near 10% today.

Others argue that technological disruption might have turned value stocks from cyclical losers to secular losers. Previous periods of lagging returns for value stocks were attributed to temporary disruptions. Today, the rate of technological change is greater than ever and entire industries are being re-imagined for the future. Amazon, eBay, and other online shopping have caused a huge secular decline in retail. The energy sector, dominated by large fossil fuel companies, is under attack from green innovators, shale innovators and politicians. Even legacy financial companies have a reason to be fearful as fintech companies have risen from zero to take a 40% share of the US personal loan business. Quicken Loans now ranks among the nation’s top mortgage lenders. The areas of disruption are so large that there are entire investment funds built around investing in these disruptor companies. If valuations grow larger and faster than earnings, this area could also be the creation of the next “earthquake” moment for value. However, at present, growth stock valuations remain within the moderate zone of historical levels. One growth manager, Polen Capital, summarizes the situation: “Hoping value stocks will outperform because they have not in so long ignores that many of the growth stocks we hold today have been outperforming because of the underlying business fundamentals and not because they are classified as ‘growth.’ They are typically well positioned in attractive markets that they themselves have often created, while many of the most commonly mentioned ‘value’ stocks involve businesses that are moving in what we believe is the wrong direction. Clearly an overgeneralization, but hopefully our point is clear.”

Pick Your Pivot Point

With solid arguments behind both growth and value philosophies, which way should we turn? Will we see a tipping point that ends the growth cycle like an earthquake? Will the growth market continue into the secular horizon? At Equitas, we always prefer to bring discussions back to the fundamentals, and in our experience recessions end growth cycles. Today, consumer confidence has dropped along with global manufacturing to near neutral levels that are neither expansionary nor contractionary. Trade policy uncertainty has correlated with most of the recent volatility in the market, and in our view may largely determine the path going forward. While we were encouraged by the latest revelation that the USA and China tentative agreed to a stage one deal, anything can happen. In an environment dominated by passive index funds, active managers have greater room to pick up strong companies at attractive valuations. Will it be growth or value? Pick your pivot point!

Yield Curve Inversion

While the 1st Quarter 2019 saw a much-welcomed V-shape recovery from the 4th Quarter 2018 decline, there are still a few clouds hanging around preventing a clear view of the future. Most notably, the yield curve inverted for the first time since July 2007. A yield curve is simply a line chart of interest rates for government bonds, with interest rates on the left axis and maturities on bottom axis. A normal curve slopes upward demonstrating the additional yield investors typically demand in exchange for a longer maturity date. When interest rates for bonds with a longer maturity trade at a lower yield than bonds of a shorter maturity, the relationship is said to be inverted. An inverted yield curve signals that market participants expect rates to be lower in the future than they are today. This can be an ominous sign for the future.

Recently, investors buying the longer term Treasuries produced another inversion of the yield curve measured by the 3-month Treasury and the 10-year Treasury. The chart below shows the shape of the yield curve at two points in March 2019.

The importance of a yield curve inversion as a signal of future information has grown over time. Since the late 1970s, there have been five episodes of a yield curve inversion with each followed by a recession. Due to a longer history of data, the chart below uses the 10-year Treasury and the 2-year Treasury although traders today tend to prefer the 3-month to 10-year measurement. According to the Federal Reserve Bank of New York, there is a 27% probability of a U.S. recession in the next 12 months, based on Treasury spreads. However, history has shown that a yield curve inversion lasting for a quarter precedes an economic recession 100% of the time. Luckily, the ominous yield curve was short lived and lasted only 6 days until March 28. In the past, an inversion had to be sustained for nearly a full Quarter to be considered a reliable signal.

History of yield curve inversions and subsequent recessions

Not Your Father’s Yield Curve

The market environment today is not the same environment we had decades ago. Since the Great Financial Crisis in 2008-2009, the Federal Reserve made unprecedented changes to their toolkit, including paying interest on excess reserves parked with the Central Bank. On top of that, the Federal Reserve recently embarked on a relatively more common tightening mission, increasing rates 7 times in the past two years. These actions have the effect of pushing up rates on the shorter side of the curve. Additionally, the Fed’s balance sheet remains swollen from the multiple Quantitative Easing programs that began after the Great Financial Crisis. In this program, the Federal Reserve purchased long-dated Treasuries in exchange for cash, which had the effect of pushing down rates at the longer end of the curve. An astute investor would conclude that these changes, which push up the shorter end and push down the longer end, make an inversion of the curve more likely. These recent unprecedented actions by the Federal Reserve are part of the reason why we urge caution when applying this multi-decade signal.

A Second Opinion from the Leading Economic Indicator Index

Looking at current economic data would be another way to gauge the likelihood of recession. Concurrent economic activity has slumped lately, evidenced by a smaller consumer spending number and lower manufacturing activity. However, leading indicators, which forecast the upcoming economic trajectory, suggest a return to growth, albeit a slightly slower growth. “The US LEI (Leading Economic Indicator) Index increased in February for the first time in five months,” said Ataman Ozyildirim, Director of Economic Research at The Conference Board. “February’s improvement was driven by accommodative financial conditions and a rebound in stock prices, which more than offset weaknesses in the labor market components. Despite the latest results, the US LEI’s growth rate has slowed over the past six months, suggesting that while the economy will continue to expand in the near-term, its pace of growth could decelerate by year end.”

U.S. Leading Economic Indicator Index

The current economic expansion has lasted more than nine years, almost the longest bull market in history. However, bull markets do not die of old age; they die of excess valuations, aggressive Fed tightening, or other large shocks. The S&P 500 ended March with a forward P/E ratio of 19.21 according to YCharts (a financial data research platform), which is high but still within the range of normal valuations. Additionally, Fed Chair Jerome Powell recently signaled patience, putting interest rate hikes on hold for “some time.” With the first two conditions all clear, the current stretch of economic expansion could continue for some time.

Duration of past U.S. economic expansions compared to the current cycle

Active and Passive Money Management

A line between active and passive investment funds is set to cross next year. Since the end of 2006, investors have withdrawn nearly $1.2 trillion from actively managed U.S. equity mutual funds, and have allocated roughly $1.4 trillion to U.S. equity index funds and exchange-traded funds (ETFs). When it comes to mutual funds and exchange-traded funds that buy U.S. stocks, those that passively track indexes now hold 48 percent of market assets according to estimates from Morningstar Inc. According to Bloomberg, the passive funds will top 50 percent in 2019 if the current trend holds. That would mark a tipping point for the investing industry, which for decades built its stature on the prowess of stock-and-bond pickers seeking to beat the markets. In this KnowRisk Report, we want to show the full picture of this trend with the pluses and the minuses because there are both.

In recent years, investors have been ditching those active managers in favor of ETFs and other index funds, which typically offer a way to get market exposure at lower fees. The trend continues. The late John Bogle, the inventor of the index fund, states:

“One development could mitigate much of the advantage that index funds enjoy and slow the rush to own them, but you’re probably not going to like it. When the market suffers a prolonged decline, active managers can gain an edge over indexers by moving large portions of assets into cash or into defensive sectors such as utilities and consumer staples. Shareholders of index funds could then suffer more than owners of actively managed funds, and they could take their losses harder due to the perceived security they feel precisely because they merely own the market and aren’t trying to beat it. That might make active investors feel a bit of schadenfreude for indexers who have been free-riding at their expense, but the feeling probably wouldn’t last. The greater price swings that could ensue in a heavily indexed, less-active market are likely to exacerbate losses for everyone. Until the next bear market, the indexing trend is likely to accelerate. As with any tragedy of the commons, indexing is the sensible thing for each individual to do, but each individual should remember that many sensible ideas, especially in investing, make less sense as more people put them into practice. When the stock market turns down again, index fund owners will have to become their own active manager and make sure they’re well diversified, with limited exposure to risk, chaos, and catastrophe.”
John Bogle, Founder of Vanguard

We use both active and passive investments at Equitas. One of the benefits to the growing trend towards passive investing is lower fees to the investor. Not only do the passive ETFs generally charge lower fees, but the competition is driving fees lower among active managers. Sophisticated investors should seek active managers in asset classes with low efficiency and high dispersion, and look to passive investing in the most efficient asset classes.

Below is some research from the Equitas analysts on the cyclicality of active and passive investing. These are the net annualized return numbers for the last 20 years for the Standard and Poor’s S&P 500 ETF, the Vanguard S&P 500 Index Fund, the actual S&P Index, and the entire Morningstar Universe of all domestic stock managers shown annualized over rolling periods and year by year from 1998 to 2017. Remember, unlike test grading in school, a money manager universe ranking lists 1 as the best and 100 as the worst.

Rolling period returns of index funds versus the active manager universe
Year-by-year percentile ranking of the S&P 500 versus active managers, 1998-2017

We thought it interesting to see the cyclicality of the swings. Some years the index is in the 12th percentile, meaning the index beat 88% of the active managers. Some years the index is in the 72nd percentile, meaning that 72% of the active managers beat the index. The index funds tend to track the index closely but underperform slightly by the amount of the fees and other fund costs.

Note the median manager in the Morningstar database underperformed the index for all the rolling periods for this bull market for the last 10 years, but over performed for the last 20 year period that includes the big bear market starting in 2000. Bull markets tend to favor index funds while bear markets tend to favor active funds according to John Bogle. We just finished 10 years of a bull market and we are not sure what the future holds. However, there is a concept called “gravitation to the mean” which tends to kick in after prolonged periods of market movement in either direction and pull market returns back to the long term average.

There is another effect from a 50/50 mix of active and passive management. This 50/50 ratio effectively takes half of the buying power out of the market. A good active manager may research an attractive company with terrific fundamentals, but the passive half of the market does not care about fundamentals and just buys across the board based on company size. Conversely, when investors go bearish and decide to sell, they tend to move as a group, sometimes known as “the thundering herd.” When the herd stampedes out of the passive investments, the active half the market may not be interested in buying the entire index of stocks, and prefers to cherry pick the ones perceived to have good fundamental characteristics. The concentration in the market has gone up with passive managers the largest shareholder in at least 40% of all U.S. listed companies. Further, this concentration raises concern about new financial risks including increased investor herding and greater volatility in times of severe financial instabilities. There may indeed be opportunities imbedded in this new risk, but what is more clear we may be experiencing increased volatility in the market going forward.

We want readers to have this information in order to make informed decisions in your own best interest. That is always our goal at Equitas.

The Cyclicality of Style and Location

The capital markets have grouped equities into two main divisions: Growth and Value. These two groups are differentiated by the “style” of the companies in the group. Investors are often confused about the differences between growth stocks and value stocks. The main way in which they differ is not in how they are bought and sold, nor is it how much ownership they represent in a company. Rather, the difference lies mainly in the way in which they are perceived by the market and, ultimately, by the investor. The beauty is in the eye of the beholder, and that beauty has cyclicality that swings back and forth. The chart below demonstrates the cyclicality of these styles.

Background

The Growth style identifies companies believed to generate superior long-term earnings growth higher than consensus growth rates implicit in the share price. The Value style seeks to identify companies that are undervalued by the market and are trading at a discount to their intrinsic value.

Growth stocks are associated with companies whose earnings are expected to continue growing at an above-average rate relative to the market. Growth stocks generally have high price-to-earnings (P/E) ratios and high price-to-book ratios. The P/E ratio is the market value per share divided by the current year’s earnings per share. For example, if the stock price is $52 per share and its earnings over the last 12 months have been $2 per share, then its P/E ratio is 26. The price-to-book ratio is the share price divided by the value of the company’s net assets per share. The open market often places a higher value per dollar of earnings on growth stocks.

Value stocks generally have low current P/E ratios and low price-to-book ratios. Investors buy these stocks because they are cheap with hope that they will increase in value when the broader market recognizes their full potential. Thus, investors believe that if they buy these stocks already at bargain prices, there is more safety from downside market risk. If the stock market experiences a recession, the value portfolio will preserve more money than if they had invested in riskier, higher-priced stocks.

Growth Investing

Growth investors are attracted to companies that are expected to grow faster (either by revenues or cash flows, and definitely by profits) than the rest. As growth is the priority, companies reinvest earnings in themselves in order to expand, in the form of new workers, equipment, and acquisitions.

Don’t expect big dividends from growth companies — for them, it’s grow big or go home. Growth companies offer higher upside potential and tend to be priced higher, therefore are inherently riskier. There is no guarantee a company’s investments in growth will successfully lead to profit. Growth stocks experience stock price swings in greater magnitude, so they may be best suited for risk-tolerant investors with a longer time horizon.

Value Investing

Value investing is about finding diamonds in the rough: companies whose stock prices do not necessarily reflect their fundamental worth. These businesses trade at a bargain share price. As the market cycle unfolds, theoretically the market will properly recognize the company’s value and the price will rise.

Additionally, since value companies are not investing as much into their own growth, they typically deliver profits to shareholders in the form of dividends. Even if the stock does not appreciate, investors benefit from these dividend payments. Value stocks tend to be cheaper, therefore, can be less volatile investments than growth stocks.

Growth or Value Stocks — a Quick Cheat Sheet

Growth stocks:

  • More “expensive” — stock prices are high relative to their sales or profits.
  • Riskier — expensive now because investors expect big things. If growth plans don’t materialize, the price could plummet.

Value stocks:

  • Less “expensive” — stock prices are low relative to their sales or profits.
  • Less risky — less expensive now because less growth is projected. Stock price appreciation isn’t guaranteed, though — investors may have properly priced the stock already leading to a “value trap” situation where the stock remains undervalued for a long time.

Growth and value investments tend to run in cycles. Understanding the differences between them may help you decide which may be appropriate to help you pursue your specific investment goals. Regardless of which type of investor you are, there may be a place for both growth and value stocks in your portfolio. Rebalancing between the two styles may help manage risk and potentially enhance your returns over time.

Growth and Value Today

Let’s examine these two investment styles side by side as of Sept 30, 2018 and see the cycles they demonstrate. The chart below displays the historical returns for growth vs value style investing over various time periods.

Historical returns for growth versus value style investing over various time periods

For the past ten years, the growth style has greatly outperformed the Value style. However, for the last 20 years, Value has outperformed Growth. What does that tell you about the first ten years? That was a time for the Value style to have its day in the sun.

Based on FactSet data, the 1,000 largest U.S. stocks by market capitalization are divided into deciles based on their beginning of year median forward price-earnings multiple. This P/E Ratio is one of the main differentiators between Growth and Value stocks. For this 20-year period ending Sept 30, 2018, low P/E stocks did better than high P/E stocks.

Low P/E stocks outperforming high P/E stocks over a 20-year period

However, recently the opposite has been true as high P/E stocks have been outperforming low P/E stocks.

High P/E stocks recently outperforming low P/E stocks

Drawing conclusions strictly based on past time periods can cause a false sense of security as history rarely repeats itself in exactly the same way. However, we have seen this phenomenon many times before. One was at the end of the 1990s when high P/E stocks significantly outperformed low P/E stocks. This was the dot com bubble. Stocks with no earnings (and therefore P/E ratios of infinity) were appreciating while value stocks were all but forgotten. Warren Buffett did not understand or believe in the technology bubble and was 50 percentage points behind the S&P500 by the time the tide turned. Julian Robertson was more aggressive and shorted the growth stocks. He experienced the old saying that “the markets can be irrational longer than you can be solvent.” The trend built to a climax in 2000, followed by a severe reversal with years of outperformance by low P/E stocks. Baron’s reported that as of the 3rd quarter 2018, the outperformance of growth over value in the past 10 years erased a lead that value had over growth for 30 years prior to 2008. This is a cyclical “reversion to the mean.”

The next two graphs show quite a significant difference in the performance of stocks separated into ten P/E ranges over the two years before 2000 and the seven years after 2000.

Stock performance by P/E range, two years before 2000
Stock performance by P/E range, seven years after 2000

Growth and Value are not the only two strategies of investing that experience times of over and under performance. The cyclical nature of domestic and international investing has also experienced mean reversion over the past few decades. The chart below shows a similar cyclical rotation pattern with different investment geographies.

Cyclical rotation pattern between US and international equities

Mean Reversion

Few things remain constant in the ever-changing world of investments. One theory argues otherwise. Mean reversion is the concept that given enough time, individual asset class returns revert to their long run averages. This reversion is not guaranteed, and cannot be timed, but in our experience has often proven valuable. Above, you can see the relative outperformance of the US vs International stock indices from 1980-2017. The pattern for the past few decades has seen one location outperform and then the opposite right after.

In the past year, US Equity earned +17.91%, while International stocks have only returned +2.75%. While the relative outperformance and underperformance look striking by themselves, the underlying reasons must be understood if they are to serve as a guide to the future. We noticed this trend and wrote about it in our 2nd Quarter KnowRisk Commentary from 2017, “Opportunities Abroad.” At the time, we were closely watching the potential for structural changes to the market. As we wrote in that report, “since 2009, the US market (S&P 500) has returned over twice the international market (EAFE).”

Since then, new factors have arisen which influence the US vs International dynamic, most notably a fiercely nationalist trend in US politics. The new regime has put the declining US trade balance, for decades taken for granted, in sharp focus now as trade disputes make headline news on an almost weekly basis. The new tax law, the new trade agreement with Mexico and Canada that will replace NAFTA, and the complaints about the annual deficit with China must all be given full consideration. With the sharply changing American political-economic landscape, and problems that remain abroad, there may still be a continuation of the current trend before reverting to the cyclical rotation. In relatively efficient markets, traders have priced all available information into the markets. The current US stock market, and growth stocks in particular, are priced above historical average while the international markets and value stocks are priced below. According to Robert Shiller, the PE ratio for the S&P 500 at the end of the third quarter was 24. (The latest 1,000 point correction only brought the S&P 500’s P/E ratio to 22.5 according to the Wall Street Journal.) MSCI quotes the EAFE (international) P/E ratio near 15 with Emerging Market valuations even lower at 13. According to Vanguard, the P/E for US growth stocks is 29, and the P/E for value is 16.

We remain believers in diversification of investment style, as well as location. There are indeed great cyclical opportunities and pitfalls in both. If buy low – sell high is still a paramount investment rule, international companies and value stocks are a much cheaper buy today. We do not attempt to predict or time markets, but we do try to recognize opportunities to buy low when they are present. The magnitude and duration of this cyclical effect on investments is hard to ignore.

The ABC’s of Asset Allocation

“Choosing an asset allocation is one of the most important decisions that investors make.”
Rodgers & Associates, 2016
“In a landmark paper published in 1986, ‘Determinants of Portfolio Performance,’ Gary P. Brinson, L. Randolph Hood, and Gilbert L. Beebower concluded that asset allocation is the primary determinant of a portfolio’s return variability, with security selection and market-timing playing minor roles.”
Vanguard, 2006
“In summary, our analysis shows that asset allocation explains about 90 percent of the variability of a fund’s returns over time.”
Roger G. Ibbotson and Paul D. Kaplan, 2001

The above quotes are just a sample; investors across the markets are clear on the importance of asset allocation. Equitas shares this view. Asset allocation is so important that we often place it in the front of investment policy statements, and we recommend for institutions to review their asset allocations annually. As important as this topic is, we still see plenty of questions and misunderstandings. These questions are understandable, particularly since a very large asset gatherer has their own particular view on the topic. We will address that later, but for now, let’s get some disclaimers out of the way so that we can cover the basics:

It is important to keep in mind that asset allocation studies are not intended as a tool to time the market. Rather, the studies are intended as a long‐term planning tool, and only indicate how different asset classes are expected to perform over long periods of time (more than 5 years). Given a long‐term time horizon, you can take reasonable investment risks with the expectation that this may yield you higher returns. Time does have a moderating effect on risk (standard deviation), and with a longer time horizon, you can increase your chances of a positive rate of return on your investments. Investments inherently involve risk, including the risk of loss of capital invested. Past performance is not a guarantee of future results.

The ABC’s of Asset Allocation

Asset Allocation is simply the name that we give to the mix of investments that make up a given portfolio. Beyond just Apple vs Microsoft stock, Asset Allocation typically refers to broader asset classes like United States Equity, Foreign Equity, United States Bonds, Foreign Bonds, Real Estate, Commodities, Private Equity, and Hedge Funds. Many firms break out large cap stocks and small cap stocks into different asset classes. Some break them out further by Value vs Growth style. The question of “Which asset classes should I use?” is answered in many ways, but generally includes between 5 and 10 separate asset classes or sources of market beta.

Separate sources of beta are generally used in order to diversify portfolios to reduce the level of systemic risk within a portfolio. For example, a portfolio consisting of all large‐cap US stock did very well in 2017 when the S&P 500 earned 22%, but did very poorly in 2008 when it lost 37%. The chart below displays the returns of several asset classes, along with a diversified portfolio labeled “AA.”

For many investors, the variance in returns of a single asset class causes material discomfort. Furthermore, diversification and rebalancing are beneficial to portfolios over time. Thus, many modern portfolios include several asset classes and are rebalanced regularly. One very common pitfall is for a portfolio to be “diversified” among US stocks and bonds, without including international or alternative assets. These asset classes can be considered portfolio “ingredients.” However, you need more than just ingredients to bake a cake; you also need a recipe that tells you how much of each ingredient.

Which Recipe to Use?

To find this recipe, many professionals use asset allocation studies, which are a blending exercise to find the most efficient mix of asset classes per unit of risk taken. These studies use mathematical properties (Capital Market Assumptions) about the different asset classes as inputs to output a series of efficient portfolios. The absolute numbers are not as important as the relative values between each asset. The Capital Market Assumptions are paramount for an asset allocation study, and often change from year to year.

The first appearance of asset allocation in literature appears to be from the year 500 A.D. The Babylonian text reads “One should always divide his wealth into three parts: a third in land, a third in merchandise, and a third ready to hand.” While it is possible that this was good advice for the time, Equitas prefers the objective, time‐tested building blocks of Markowitz and the Capital Asset Pricing Model (CAPM).

Modern Portfolio Theory

In 1952, Economist Harry Markowitz introduced Modern Portfolio Theory with his essay titled “Portfolio Selection.” In 1990, the Royal Swedish Academy of Sciences awarded the Nobel Memorial Prize in Economics to Markowitz for this theory of portfolio choice. In his essay, Markowitz uses assumptions about rational investors and markets to find an “efficient frontier” of portfolios that maximize return for any given level of risk. While this work remains extremely important, a flaw remained in that future returns do not always equal historical returns. Decades after the original publication of “Portfolio Selection,” Fischer Black and Robert Litterman published a solution to this problem in 1992. This model starts with the assumption that an investor can approximate the “market allocation” by using the market cap of various asset classes. They then use that assumption to work backwards to “discover” the implied future returns created by this market allocation. This model also allows an individual investor to apply his or her own view. Equitas Capital Advisors uses this method every year to calculate the Capital Asset Market Assumptions we use for our clients.

The efficient frontier of portfolios that maximize return for a given level of risk

From time to time, our on‐going research reveals other investment managers who decide to use another process. For example, JP Morgan formulates their Capital Asset Market Assumptions as part of a proprietary process where they look beyond the numbers, including assumptions from their staff. In the 2018 edition of their assumptions, they considered the effects of secular themes, including global aging and technological innovation, and cyclical factors — notably the slow path of policy normalization and elevated equity valuations — that they believe will influence asset returns over our 10‐ to 15‐year investment horizon. During this period, they expect more modest returns in many asset markets, and subjectively lowered their assumptions accordingly. More specifically, their qualitative methodology starts with a model that was originally developed for firm specific projections. Then, they modify that methodology in attempt to apply it to the entire economy as a whole. This model involves more assumptions (uncertainty) about the US economy, and further requires that these assumptions remain constant in the projection rather than the variable nature they have expressed historically. We tend to default to the Nobel awarded Markowitz/Black‐Litterman methodology which was designed specifically for this purpose, and has served us well over our tenure.

Many smart investors try to predict, and time the markets using what they imagine to be an informational advantage, or what is commonly called guessing. In 2014, CXO Advisory Group set out to perform a study of whether industry experts were able to accurately time the markets. They scoured the web for predictions, and found 28 “gurus” who had more than 100 predictions during the period 2000 to 2012. As a background, previously Will Sharpe published a study on market timing that suggests that a market timer would have to be right and average of 74% of the time in order to beat a simple buy and hold strategy. The results, which we believe speak for themselves, are shown in the table below.

Forecast accuracy of 28 market-timing gurus, 2000-2012

Is your Asset Allocation on the Black‐Litterman Efficient Frontier? Contact our offices to find out.

How Is Your Hippocampus?

Why does everything in the press these days seem to be a crisis? A crisis triggers emotions that have a powerful effect on people. The press has discovered this power and has become very good at triggering and manipulating emotions. Both the press and advertisers are fighting for shelf space in your memory. Emotions are a powerful link to memory.

Emotion and memory are closely related. You know this from your own experience. Go to a party, and meet a bunch of new people. Which faces are you going to remember? The woman who made you laugh? The man who made you feel embarrassed? Your new boss? You remember the ones who made an emotional impact.

Thus, you would not be surprised to learn that the system of the brain that controls emotion, the “limbic system,” is also in charge of transferring information into memory. Even further, from years of experiments and surgical experience, we now know that the specific location for this transfer is a portion of the temporal lobe called the hippocampus.

Hippocampus

The hippocampus is a small organ located within the brain’s medial temporal lobe and forms an important part of the limbic system, the region that regulates emotions. Psychologists and neuroscientists generally agree that the hippocampus plays an important role in the formation and indexing of new memories about experienced events. Part of this function is hippocampal involvement in the detection of new events, places and stimuli. This is partly why returning to a location where an emotional event occurred may evoke that emotion. There is a deep emotional connection between episodic memories and places. The hippocampus is responsible for processing of long-term memory and emotional responses. We would not even be able to remember where our house is without the work of the hippocampus. The hippocampus also encodes emotional context from the amygdala.

Amygdala

When you think of the amygdala, you should think of one word: fear. The amygdala is the reason we are afraid of things outside our control. It also controls the way we react to certain stimuli, or an event that causes an emotion, that we see as potentially threatening or dangerous. The amygdala is a limbic system structure that is involved in many of our emotions and motivations, particularly those related to survival. The amygdala is involved in several functions of the body including fear responses, emotional responses, hormonal secretions, arousal, and memory. The amygdala is involved in the processing of emotions triggering the fight or flight response.

The Fight or Flight Response

During the fight-or-flight response, the amygdala takes over. The structure causes the adrenal gland to release epinephrine into the bloodstream, along with other hormones that signal the heart to pump harder, increasing blood pressure; open airways in the lungs; narrow blood vessels in the skin and intestine to increase blood flow to major muscle groups; and perform other functions to enable the body to fight or run when encountering a perceived threat. Many bodily functions take a back seat during the fight-or-flight response.

The term perceived threat makes an important distinction and brings up a critical point to remember. As in the case of chronic stress, the body’s stress response is triggered repeatedly on a daily basis in response to actual physical and psychological threats as well as perceived psychological threats. As a result, the body can become exhausted, and the overabundance of epinephrine and cortisol (as well as other aspects of the body’s stress response) can become maladaptive, resulting in lowered immunity and other health problems. Hyperactivity of the amygdala has been associated with fear and anxiety disorders.

Fear is an emotional and physical response to danger. Anxiety is a psychological response to something perceived as dangerous. Anxiety can lead to panic attacks that occur when the amygdala sends signals that a person is in danger, even when there is no real threat.

How Do You Let Fear Affect Your Investment Portfolio?

In February, markets were sitting at the top of a bull run that began years ago. Suddenly, the release of some macro-economic data sparked fears of inflation and higher bond rates. This fear caused a panic that lead to the S&P 500 dropping from its high at 2872 to 2581, a 10% drop. Markets had begun to recover into March when the “f” word reared its ugly head again, this time in the context of a trade war with China. What changed in the market? The companies were still making as much money. They were still paying the same dividends to shareholders. The difference was fear and its ability to cause panic selling.

Some investors have positioned their portfolios defensively for a big portion of this nine-year post Financial Crisis bull market. Some have been afraid that a recession is “just around the corner” allowing their amygdala to rule the day and missing opportunities for years. A little bit of research might have helped these investors have confidence in a long-term strategic portfolio that does not rely on market timing. For example, according to Ned Davis Research, the stock market has declined 5-10% 77 times in the last 70 years. It is practically an annual event. On average, the recover from these levels has taken one month, assuming you did not get scared out of the market.

What Would Your Hippocampus Say?

The hippocampus and amygdala work in concert to consolidate our emotions and long-term memories. This process is critical for evaluating information in order to respond appropriately to situations. However, the amygdala has a trump card! Whenever a possible fight or flight emotion is perceived, the brain’s nutrients, blood flow, and oxygen are directed to the amygdala. This saps the other parts of the brain clouding creativity and rationality. The brain becomes less concerned with painting the next Mona Lisa when it perceives a possible attack by a lion. Remember this when viewing the next “crisis” on the news, or the next irrational drop in the stock market. Is this really a crisis? Are you being manipulated? What would your creative, rational hippocampus say?

Bitcoin – Boom or Bust?

With the massive surge in price last year, Bitcoin and a plethora of other cryptocurrency investments have dominated recent chatter around investments among not just financial professionals, but also the general populace. Cryptocurrencies are a digital asset that uses cryptography, or the science of keeping information secret from third parties, to control the integrity of the asset system. The technology has been commented on by everyone from Jamie Dimon, head of JPMorgan Chase, to college students who now imagine themselves to be big time day traders.

Bitcoin price from Q3 2017 through its December 2017 peak

With a meteoric rise from $4,162 per Bitcoin (BTC) at end of 3rd Quarter 2017 to over $19,000 per BTC at its peak in December 2017, it is no surprise that this is a popular topic. With advocates of bitcoin claiming that it has the potential to replace our current financial system, we thought it was time to cover the nuts and bolts of Bitcoin in this Quarter’s KnowRisk report.

Background

Bitcoin was invented by the unknown entity currently called “Satoshi Nakamoto.” In October 2008, the very middle of the Great Financial Crisis, Satoshi published a white paper that criticized the centralization of online commerce by third party financial institutions. He was very critical of the fractional reserve system and saw his creation of Bitcoin as a way to attack it. Instead of a third party trust-based model, he designed a peer-to-peer system based on cryptography and “proof of work.” The digital ledger controlled by this peer-to-peer system is known as the “blockchain” and Bitcoin is the cryptocurrency with the largest market cap that uses this technology. An important function of his design sought to give any would-be attackers a higher incentive to act “honestly” rather than for their own dishonest benefit. Bitcoin, thus, is ultimately a payment processing network which is often compared to the likes of Visa and Western Union.

Bitcoin transaction volume compared to Visa and Western Union

In 2014, Western Union processed an average of 30 transactions every second. Currently, Visa processes an average over 1,500 transactions every second. In 2016, Bitcoin processed an average of 3-4 transactions a second (source: Blockchain.info). These transactions are important, because transactions processed are one of Bitcoin’s only inherent fundamental qualities outside of the price.

Metcalf’s Law

In the 80’s and early 90’s Robert Metcalf and George Gilder were studying the value of communications networks. Their original work applied to telephones, and discussed how a network such as a telephone system that could access 1,000 other phones was more valuable than a phone that could access only a single other phone. In simple terms, Metcalf proposed that the value of any network was proportional to the square of the number of contacts within that network. This was considered an interesting but untestable theory for a while. The theory was finally tested (and proven true) in 2013 and 2015 with datasets from European internet providers and in social networks like the ones owned by Facebook and Tencent. In late 2017, Tom Lee, the cofounder of FundStrat Global Advisors, repeated the Metcalf test on Bitcoin.

Metcalf's Law applied to Bitcoin's price versus transaction volume

As the above chart shows, Metcalf’s equation can explain over 94% of the move in the price of bitcoin over a period of a few years. Thus, Bitcoin grows more valuable as more people complete transactions in Bitcoin. At its current average of 350,000 transactions per day, Metcalf’s law suggests that Bitcoin should have a market cap of $122 billion. The actual market cap as of 1/25/18 is $189 billion, leading some to fear over-valuation. Others might respond that the rate of adoption could happen faster than anyone anticipates which suggests that the current valuation could be fair. At 7 transactions per second (the current theoretical upper limit) Metcalf’s law suggests BTC should have a valuation of $375 billion, a 62% premium compared to the current valuation.

Trading

Beyond Metcalf, many traders have made small fortunes trading Bitcoin and its cryptocurrency siblings based on technical factors. A Tulane University senior who we have interviewed claims to have turned $20,000 into over $1,000,000 through this strategy. Using only technical analysis he sits in front of a monitor watching for a breakout pattern (explosive upwards movement) in a coin, at which point he buys the coin to ride the wave up and then sells once momentum cools. When not actively trading, he prefers to leave his funds in the US Dollar or the coin “Tether” which attempts to maintain price parity with the US Dollar.

Criticism

For all of its benefits, Bitcoin is not without criticism. Speaking of transactions, Bitcoin has a current upper limit of 7 transactions per second due to its technical design (source: CryptoCompare). This is a far cry from the peak of 47,000 transactions per second that Visa confirmed it processed in 2013 and the difference is the subject of much debate in the Bitcoin community. The issue has inspired its own Wikipedia article (Bitcoin scalability problem), and was the genesis of the creation of several other “alt-coins” which share similarities with Bitcoin. Litecoin and BitcoinCash are two alt-coins that have addressed this issue.

Another issue with Bitcoin’s design is in the “proof of work” network requirement. The peer-to-peer machines that validate transactions consume a vast amount of electric power. According to Digiconomist, a widely followed Bitcoin publication, the Bitcoin network as of January 2018 is on pace to consume 44.28 terawatt hours (TWh) of energy a year, more energy than the entire country of Denmark. Some coins like Ethereum have proposed to use this computing power to run programs and applications. As of 2018, Ethereum is processing over a million transactions a day with a current market cap of $101 billion (Coinmarketcap.com). Other coins like Neo have been developed to use a concept called proof of stake rather than proof of work.

Risks

While these cryptocurrencies represent a new evolution of computing and finance, they are not without risks. The biggest current risk at the moment is simply the volatility. For example, Bitcoin at $11,000 in January 2018 is down 41% compared to its previous high of $19,780 in December 2017. The volatility is a product of the current relatively low market cap, and the ability for large traders to have huge influence over the aggregate price.

Further risks involve the “middlemen” who run exchanges. The largest exchange in 2014, MtGox, went bankrupt with accusations of fraud and hacking surrounding it. Many who held their coins on the exchange lost their holdings. Other exchanges have experienced hacks and interruptions of service. Even if the crypomarket does become the future, there is the risk that Bitcoin is the “Myspace” of the crypto world that will eventually be replaced by another coin like Facebook replaced Myspace. Risks are inherent in all investments, and the suitability of any investment depends on the risk tolerance of the investor.

Jamie Dimon, for what it’s worth, has since stated he regrets calling bitcoin a fraud, and now agrees that the “blockchain is real.” He still maintains concerns over how governments will react once Bitcoin grows large enough to represent a real challenge to the current financial system. Hundreds have already been arrested for money laundering and other failures to follow regulations. Foreign governments, mostly in Asia, have at times banned or threatened to ban the currency, sending shockwaves through the exchanges.

Just last week, the SEC’s Director of Investment Management Dalia Blass asked sponsors to refrain from initiating registrations for funds investing in cryto-related funds citing “a number of significant investor protection issues that need to be examined before sponsors begin offering these funds to retail investors.” Others, however, are not waiting for clear regulatory approval. Don Steinbrugge, Agecroft Partners managing partner, says there are already 150 crypto and bitcoin hedge funds. HFR, a leading hedge fund research organization has created their own cryptocurrency index. This index of cryptocurrency hedge funds earned +2,972%, over double the return of bitcoin itself, for the single year 2017. Whatever the future holds for bitcoin, those who ignore the cryptocurrency market risk being left behind.

The Rise of Artificial Intelligence Investing

“Technologies continue to advance. They accelerate the progression of seemingly unrelated technologies, exploding what is possible at a pace that is difficult to fathom. This helps redefine what is possible today, and in our rapidly approaching tomorrow.”
KnowRisk® · Welcome to the Exponential Age — The New Industrial Revolution

Artificial intelligence is a branch of computer science that aims to create intelligent machines that teach themselves. Much of AI’s growth has occurred in the last decade. The upcoming decade, according to billionaire investor Mark Cuban, will be the greatest technological revolution in man’s history! This report will provide an understanding of AI, real-life examples, and AI’s effect on investing.

The Rise of Artificial Intelligence

It is springtime for Artificial Intelligence. More progress has been achieved in the past five years than in the past five decades. Rapid machine-learning improvements have allowed computers to surpass humans at certain feats of ingenuity, doing things that at one time would have been unfathomable. IBM calls the autonomous machine learning field ‘Cognitive Computing’. The ‘Cognitive Computing’ space is bursting with innovations; a result of billions of research and investment dollars spent by large companies such as Microsoft, Google and Facebook. IBM alone has spent $15 billion on Watson, its cognitive system, as well as on related data analytics technology.

Arthur Samuel’s checkers-playing program appeared in the 1950s. It took another 38 years for a computer to master checkers. In 1997, the IBM Deep Blue program defeated world chess champion Gary Kasparov. Around the time Deep Blue first started learning chess, Kasparov declared, “No computer will ever beat me.” That historic accomplishment took IBM 12 years.

Artificial Intelligence first started hitting the mainstream headlines in 2011 when IBM’s Watson beat two human contestants on TV’s Jeopardy. This was the landmark milestone of its time, especially if you consider one of the players was Ken Jennings (who holds the record for the consecutive wins (74) on the quiz show). Getting to that moment took five years. IBM’s Watson spent four of them learning the English language, and another year reading — and retaining — every single word of Wikipedia, plus a few thousand books.

No computer was ever supposed to master the game “Go”, but it did. Go was invented in China in 548 B.C. It is a game of ‘capture the intersection’ played on a 19×19 grid with each player deploying a combined cache of 300-plus black and white pebbles. Go is chess on steroids. In fact, the possible board permutations in Go vastly outnumber the board permutations of chess.

Designed by a team of researchers at DeepMind — an A.I. lab now owned by Google — AlphaGo was an A.I. system built with one specific objective: understanding how the game of Go was played and learning to play it very well.

AlphaGo’s minders never gave it the rules of the game! They fed it tens of millions of Go moves from expert players and the computer had to figure it all out. The concept of reinforcement learning was put to the test by way of millions of matches that the system played against versions of itself; neural network-versus-neural network. The results and key lessons were fed back to AlphaGo, which constantly learned and improved its game. The operative word is learned. AlphaGo not only knew how to play Go as a human would, but it moved past the human approach into a completely new way of playing.

The expectation-defying pace at which A.I. milestones are being reached, is only one reason why we believe we have crossed the Rubicon. Broader technological, societal and economic forces are coming together to create a historically unique backdrop for machine learning to have its day. We believe that there is a radical and irreversible change from Artificial Intelligence about to disrupt the investment industry. Autonomous Learning Investment Strategies (ALIS) is the next investment process paradigm, heralding what Wired Magazine recently called the ‘Third Wave’ of investing. ALIS is about to transform the investment process.

A.I., Machine Learning, and Deep Learning

Artificial intelligence is a branch of computer science that aims to create intelligent machines, and much of A.I.’s growth has occurred in the last decade. There is a fundamental difference between the broad category of A.I. and its subset categories, Machine Learning, and Deep Learning, which needs to be understood to avoid confusion. The easiest way to think of their relationship is to visualize them as concentric circles with A.I. as the entire realm, then machine learning, and finally deep learning which is driving today’s A.I. explosion. We graphed this for you.

Artificial Intelligence — Any technique that enables computers to mimic human intelligence using logic. At Equitas we do not consider this true “artificial” intelligence as the computers are programmed with algorithms that tell it what to do. This is more the automation of human intelligence and should really be in another category. Robo-Advisors is a term used in this category which is misleading and does not involve robots or artificial intelligence at all. Rather, robo-advisors are algorithms built to automate the calibration of a financial portfolio to the goals and risk tolerance of the user. The term has a chic appeal that has made it popular which tells us that people intuitively have a desire for “real” artificial intelligence.

Artificial Intelligence, Machine Learning, and Deep Learning as concentric circles

Machine Learning — A subset of A.I. that includes statistical techniques that enable machines to improve at tasks with experience. This is the first real step into artificial intelligence in our opinion. Machine Learning at its most basic is the practice of using algorithms to parse data, learn from it, and then make a determination or prediction about something in the world. So rather than hand-coding software routines with a specific set of instructions to accomplish a particular task, the machine is “trained” using large amounts of data and algorithms that give it the ability to learn how to perform the task.

Deep Learning — A subset of Machine Learning composed of algorithms that permit software to train itself to perform tasks. IBM Watson is an example of this. Deep Learning has enabled many practical applications of Machine Learning and by extension the overall field of AI. Deep Learning breaks down tasks in ways that makes all kinds of machine assists seem possible, even likely. Driverless cars, better preventive healthcare, even better movie recommendations, are all here today or on the horizon because of Deep Learning.

Zettabytes?

The amount of data available is staggering. At the core is the explosion of digitally stored data. Over 80% of this data is raw and unstructured data such as satellite images and Twitter. Since there is more data available, fast comprehension of that data is important. Let us stop for a moment to try to comprehend this deluge.

Digital information is measured in bytes. One bit (short for binary digit) is the smallest unit of data in a computer. Eight bits are equal to one byte. Prefixes, denoting mathematical powers, allow us to keep track of all these bytes. (Remember the good old gigabyte?) The typical hard drive of a single PC in 1995 would have been one gigabyte. Then terabyte came along. One terabyte is one trillion bytes. It takes 1024 terabytes to make up one petabyte. The 2014 IDC Digital Universe Study found that 90% of all petabytes are believed to have been created since 2012.

In 2006, there were only around 100 exabytes worth of data on the internet. Today, that number is about 10,000 exabytes. We are now counting data in zettabytes, which equals one thousand exabytes. Just to show scale, one zettabyte is more than four million times the size of the entire US Library of Congress!

Growth of global digital data

What human can keep up with all that data unassisted? Artificial intelligence computers can comprehend data faster than humans can and with exponentially less cost. A million dollars of computing power in 1980 costs less than 4 cents today.

Human Behavioral Sciences

Webster’s Dictionary defines behavioral science as a branch of science such as psychology, sociology, or anthropology that deals primarily with human action and often seeks to generalize about human behavior in society.

Understanding human behavior is crucial for investors, according to Alliance Capital Management CEO Lewis Sanders, who talked about behavioral finance and its role in pricing anomalies and forecasting bias during a presentation at Wharton. The human emotions of fear, greed, elation, regret, inertia, etc. may have more to do with investment behavior than fundamentals. This is especially true in a stock market that some sources show is now over 40% invested in passive index funds and ETFs. Passive investments care nothing about fundamentals and only move with the emotional whims of the investors. Society has been observing human behavior for 5,000 years. Unlocking the key to behavioral finance could be the “Holy Grail” of investing. We think AI has the best chance of succeeding and gaining the competitive advantage.

Robo-Advisors

In the investment management business, it is now the time of the Robo-Advisors. The term “robo-advisor” was essentially unheard-of just five years ago, but it is now commonplace in the financial landscape. The term is misleading and does not involve robots or artificial intelligence at all. Rather, robo-advisors are algorithms built to calibrate a financial portfolio to the goals and risk tolerance of the user. Users enter their goals, age, income, and current financial assets. The advisor (which would more accurately be referred to as just an “allocator”) then spreads investments across asset classes and financial instruments in order to reach the user’s goals. Robo-advisors have gained significant traction with millennial consumers who do not need a physical advisor to feel comfortable investing, and who are less able to validate the fees paid to human advisors. It reveals a desire for real AI computer service.

Hedge Funds

Artificial intelligent hedge funds are on the rise as well. The application of AI in the hedge fund industry is still at an early stage. Some hedge fund managers are utilizing AI as a partial input into their trading process (retaining their discretionary control over investing and risk management) while others, ‘pure AI hedge funds’, have outsourced both the trading and risk management aspect to the machine with minimal input from the fund manager.

The biggest success of a computer driven manager is Renaissance Technologies LLC, an East Setauket, New York based investment management firm founded in 1982 by James Simons, an award-winning mathematician and former Cold War code breaker. Renaissance specializes in systematic trading using only quantitative models derived from mathematical and statistical analyses. Renaissance is one of the first highly successful hedge funds using quantitative trading — known as “quant hedge funds” — that rely on powerful computers and sophisticated mathematics to guide investment strategies.

Note that these are scientists and mathematicians, NOT portfolio managers. Change in business tends to come from the outside. The Medallion Fund uses an improved and expanded form of Leonard Baum’s mathematical models, improved by algebraist James Ax, to explore correlations from which they could profit. Simons and Ax named it Medallion in honor of the math awards that they had won.

Because of the success of Renaissance in general and Medallion in particular, Simons has been described as the best money manager on earth. By October 2015, Renaissance had roughly $65 billion worth of assets under management, most of which belong to employees of the firm. Renaissance’s flagship Medallion fund is completely computer model driven with no input from humans. From 1994 through mid-2014, the fund averaged a 35% net annual return!

“We (employees) never override our models.”
Jim Simons, Renaissance Technologies · Rubin, Richard, “How an Exclusive Hedge Fund Turbocharged Its Retirement Plan,” Bloomberg, June 16, 2015

A.I. Hedge Fund Database

Eurekahedge AI/Machine Learning Hedge Fund Index performance

As can be seen in the figure above, the Eurekahedge AI/Machine Learning Hedge Fund Index, currently consisting of about 30 funds, has outperformed traditional hedge fund managers such as quants, CTAs, trend-followers, and the average global hedge fund index since 2010. Leon Cooperman, an old-school veteran, summed up the current state of the industry succinctly as “under assault”. An old school style of research may include playing golf with company management in order to “perceive” some valuable insight into the company. A few months later, Cooperman was charged by the S.E.C. with insider trading. He has refuted the charges. While some managers who have relied on human judgment may adopt ‘big data’ scraping methods going forward, transitioning into an industry that is evolving at warp speed is unlikely to be easy. Could research insights gained through artificial intelligence be deemed insider information?

Don’t Worry, Humans are Not Obsolete!

All is not lost for human beings! Apparently, humans and machines work well together. The chart below shows the results. By one estimate, as of 2011, there were some 206 all-time highest-rated chess performances (victories requiring the fewest moves) in tournaments that included humans, computers, and so-called cyborgs (combinations of man and machine — named from Star Trek of course).

Highest-rated chess performances: human, computer, and cyborg

One study of those performances showed 80% of the games were turned in by the cyborgs. Now consider the possibility of a cyborg-type scenario with humans and machines working together within the context of running an equity long/short hedge fund. Humans making grand strategic decisions — take digitized health-care records as a boom sector worth following for example — aided by machine-learning algorithms that equal the intellectual firepower of 10,000 analysts. Such a scenario sets the stage for endless investment possibilities not to mention a potentially epic organizational culture clash between MBAs and scientists.

The Third Wave

I have been in the industry since the 1980s when bank trust departments were the investment norm. The industry innovations came from outside the traditional asset management industry. This was predicted by Clayton Christiansen, the Harvard Business School Professor and architect of disruptive innovation. The first wave of discretionary hedge fund managers came from proprietary trading desks, floor traders, and event driven risk-arb firms; not Fidelity, Vanguard, or a bank trust department. The second wave, in the 90s, came from mathematics and physics, not discretionary hedge funds. They brought a hypothesis driven quantitative approach to investing. The third wave, Autonomous Learning Investment Strategies (ALIS), exploits the confluence of data, data science, machine learning, cheap computing power, combined with intelligent human beings. ALIS managers’ brains are wired differently. They are often physicists, scientists, hackers, or computer gamers with a healthy disrespect for convention. They are poised to make today’s investment Ferrari look like yesterday’s horse and buggy.

Opportunities Abroad

We are long believers in the power of international diversification. However, since 2009 the US S&P 500 has returned over twice the international market (EAFE). The increased domestic equity performance over international equity has been beneficial to domestic investors but has also created a wide dispersion in valuation. The international equity markets are cheaper.

Through the second quarter of this year, we’ve begun to see signs of life abroad as the international index EAFE has returned 14.23%, and the Emerging Markets index earned 18.43% year to date compared to the S&P’s 9.34%. What factors are driving this performance? Will it continue into the future? We took a deep dive into the research to find out in this KnowRisk report.

As you know, at Equitas we do not attempt to predict future events, only recognize current opportunities. Sometimes opportunities can take a while to manifest into profitable investments. We have been researching the possibility, probability, and timing of a change in market leadership to capture the low international market valuation. We are starting to see evidence.

John Vogelstein of New Providence Asset Management is moving to a 30% domestic 40% international mix. We have known Mr. Vogelstein from his time as President and CIO of Warburg Pincus, and partner with Lazard Freres. The move is aggressive and would have been inefficient and too early for the last nine years, but the timing may be correct today.

After the Global Financial Crisis in 2007-2008, the US Central Bank was one of the first central banks to respond with liquidity measures. The Federal Reserve implemented not one, but four separate programs to inject cash into markets that were starved of liquidity. The chart below shows the timing of those programs.

Federal Reserve and European Central Bank stimulus timing

The chart also shows the European Central Bank (ECB) beginning their bond buying program years later in 2015. While some government bond programs began earlier, they were much smaller in size. All of the ECB stimulus measures only amounted to half of the balance sheet by 2012, whereas the US’s measures quadrupled the balance sheet. All of the cash added to markets needs a place to go and the effects are beginning to be felt in both the European economy, and the stock market.

Earnings growth is a major factor that can help push up stock prices. This is a key metric that we watch closely. We pointed to an earnings rebound in our third quarter 2016 KnowRisk to identify an opportunity in US Equities. This chart shows earnings growth has been flat to negative in international markets since 2011. In 2017, we are beginning to see signs of life.

International earnings growth since 2011

To summarize, below are some points which differentiate between domestic and international equity which helps paint the picture. US profits are currently +30% above their pre-crisis levels while International profits are roughly -30% below. Since the trough in profits in 2009, the S&P has returned approximately 210%, over two times as much as the ACWI ex-US.

  • Since 2009, the US Federal Reserve has remained more consistently accommodative than other central banks. Therefore, US economic growth and profits remained in expansionary territory while many international regions faced multiple recessions (Europe 2011-13, Japan 2010-12 & 2014-15, Emerging Markets 2014-15).
  • We think the profit and performance gap between the two regions should close to favor the ACWI ex-US. International growth estimates are expected to accelerate vs. the US, which should help close the gap in profits seen above and could fuel a multi-year period of better International returns relative to US.

Earnings projections are painting an even more optimistic picture.

International earnings projections

In order to weigh how much equity risk should be taken domestically vs abroad, there are a few other factors to examine. There is a lot of optimism currently built into the US market resulting in over $3 trillion in market gains in the last seven months. If the anticipated 15% corporate tax rate is enacted there should be a further surge in US corporate profits. However, if it is delayed or fails, a lot of the optimism may turn to disappointment.

The US is much further along in taking corrective action after the Great Recession and it shows in earnings and market performance. The result is the international markets have underperformed and are now priced cheaper than the US. The question is the timing of when this reverses and reverts to the mean. No one knows the exact timing of a market change like this, but a reversion to the mean is certainly closer than it has been since 2009, and may have begun.

Active vs. Passive Investing

The evolution in the asset management industry has picked up pace in recent years. A long term trend has been taking place in the industry, as index funds and ETFs have significantly increased their share of assets under management. Since their first appearance in the US in 1975 (index funds), and the mid 1990’s (ETFs), passive management is estimated to have grown to 40% of the stock market. We use both strategies here at Equitas and it is important to know the differences between the two.

Actively managed equity funds have been underperforming and losing market share, while index funds and ETFs have gained market share. This is causing a fundamental shift in how investors think about capital allocation, track risk adjusted returns, and the value added by the underlying managers. The classic strategy of active managers following Graham and Dodd methodology is to find companies whose intrinsic value is higher than the current market value, and wait for the rest of Wall Street to discover the hidden value and push up the stock price. The new environment causes problems with that strategy.

The environment for active money managers has been confusing and tough. For example, one of our money managers has been a large investor in the Liberty Companies (LVNTA), a group of companies controlled by John Malone. John has had a great track record of creating wealth for his investors. An article in Barron’s this year compared his results to Warren Buffett’s, and found that over the last 10 years, Malone’s companies have returned +13% per year vs. +7.5% for Buffett’s Berkshire Hathaway, and +7.7% for the S&P 500. For the most part, these businesses did very well, and the intrinsic value increased. However, the stocks did not reflect this growth in value and decreased. Let me give you the specifics.

As the following chart shows, for 2016 the tangible assets of Liberty increased $11 from $44.50 per share to $55.20 per share, a +24% increase. However, the stock dropped $2.60, from $45.11 to $42.50 or a -6% decrease (this is on a pre-split basis for comparative purposes). The spread between intrinsic value and the price of the stock widened to 30%! A momentum investor might have sold the stock. A passive investor ignores intrinsic value and all other fundamentals. The fundamental value style manager held firm and the stock was up 18% in January 2017. They expect more appreciation to follow as investors recognize this value. The question is which investors will recognize the intrinsic value, and when will they act.

One of the reasons for a wide discrepancy between intrinsic value and stock price is the new fundamental effect of passive investing. As the chart below shows there has been a huge move of money going out of active managers and into passive vehicles like ETFs and index funds. The Liberty stock is not a part of any index, and is mostly owned by active managers. Both sides of this scenario are a negative for the stock.

What everyone seems to have forgotten is that the active/passive investing preference is cyclical. As the following chart shows, the index funds swing from the 20th to the 80th percentile in the universe of active money managers. A ranking of 20 means the index beat 80% of the active managers. A ranking of 80 means that 80% of the active managers beat the index.

Active vs. Passive Investing percentile cycle

We don’t know when, but the cycle should eventually come around, and active management will again prove its worth. With higher rates comes greater dispersion in the market (correlations are already coming down to levels we haven’t seen since 2007), which should be a good environment for active stock pickers. One of the consequences of the shift from active managers to passive vehicles is that because money flows tend to follow the direction of the market, the momentum of the swings takes the index to extremes past the valuation point in both directions.

The big question is whether this is good, or bad, for the remaining active managers. We could build a case either way. It could be bad if the managers do not assess the new fundamental factor of having 40% of the market now invested passively and affected solely by money flows. It could be good if the managers can assimilate the new fundamental of the passive investments and invest around this factor with offensive and defensive strategies.

Passive investing does not account for the fundamental values of any stock. No earnings, no growth projections, no PE ratios, no assessment of company management, stock price, nothing is relevant to the indiscriminate index buyer. In most cases, stocks are bought across the board regardless of price according to size of the company. This means that the only variable is money flowing into, or out of, the index funds, which creates a “risk on/risk off” behavior in the market. Behavioral Sciences will be an even more important fundamental to assess. This is pure human nature, which tends to follow a herd mentality and move past intrinsic value going up, and down. We believe this is a new fundamental to be considered for successful investing.

Active vs. Passive Investing correlation and dispersion

“When one buys an S&P index fund, one buys all the stocks in the index — whether cheap or expensive, and today the price-to-sales ratio of the median stock has surpassed its level in 2000 and 2007.”
Ned Davis, Ned Davis Research

But lately the correlation is fraying, a sign that “the trend toward passive investing is overextended.” Davis thinks the next five years will present great opportunity for active managers to outperform passive indexes.

Since 2007, macro-economic factors have driven correlation to historically high levels. Since the election, however, the correlation between the investment sectors has come way down and the sector dispersion has increased significantly. Active managers tend to outperform when dispersion of returns is high, and correlation of returns is low, hence an inefficient market.

This allows for unique insights gained from investment research to be beneficial in the investment process. Unfortunately for active managers, the 40% allocation to this new passive management style does not follow or react to fundamental stock research. A return to wide stock dispersion should be good for active equity managers and long/short managers that look to make money on both sides of the market. Active managers like to see a wide variance between winners and losers that they can capture for profit. We believe the environment may be in place for the pendulum to swing back, a return to the mean, with lower correlation, higher stock dispersion, and potential future performance for active managers.

The State of Oil and Gas

In our Second Quarterly letter of 2016, we welcomed our friends and intelligent investors to the Exponential Age, a new industrial revolution for the world. While we wrote briefly about the amazing, logarithmic changes coming to automobiles, we thought the topic converged nicely with a large area of investment interest: oil and other fossil fuels. As we began our research work, compiling charts and tables to get a firm grip on this area, we thought the results were compelling enough to share with you in this KnowRisk.

Drillman’s Paradise

Louisiana has the largest concentration of crude oil refineries (second in total number), is the third largest producer of petroleum, and is a top producer of natural gas in the USA. Many investors local to the gulf south are perhaps more familiar with the oil industry and its volatility than they should be. For those who are not, the chart below shows the price of oil falling dramatically in late 2014 from post Financial Crisis highs. This drop caught many intelligent investors by surprise. Some mistakenly bought into the dip, while others sat cautiously on the sidelines, waiting for a bottom. One tool we use to help sort fact from fiction is Supply and Demand analysis.

Oil Market Report January 2016

Supply and Demand

Starting in the beginning of 2014, the global supply of oil increased dramatically. Improvements in fracking technology and the expansion of the number of wells in America (from 400 in 2010 to 1,400 in 2014) completely changed the global oil game and the supply of oil sharply increased. This essentially flooded the market with so much oil that demand and even storage could not handle the volume at a price anywhere near the previous +$90/barrel prices of 2015. To compound the issue, many oil exporting nations rely on oil revenues to balance their budgets to supply cheap energy and other necessities to their populations. Thus, in a strange reversal, some producers began to increase production in response to falling prices. This created a negative feedback cycle until businesses and the rigs that were unsustainable at the new lower prices exited the market.

As for the demand side of the equation, usage remained on its relatively slow and stable growth as consumers chose to pocket the savings rather than dramatically increase their usage of oil through transportation or other means. In late 2014, with oil prices falling, the data on increased supply and excess production was available. Accessing and processing this data is vital in telling the difference between a falling knife and a temporarily depressed asset.

US oil rig count

Outlook

While we have covered the current status of oil market dynamics, we need to be continually conscious of the supply/demand environment developing in the future. One of the biggest changes was mentioned in our KnowRisk released after the 2nd Quarter 2016, when we talked about the exponential growth of self-driving and electric cars, as well as the growth of the solar energy industry more broadly. To give specific figures on that growth and its impacts, our research has revealed that between gasoline and low sulfur diesel fuel, almost 70% of our oil use lies in the transportation sector. Germany, a large manufacturer of automobiles, has voted to ban new combustion engines by 2030. We do not think it will take that long. In the US, oil consumption peaked in 2005 and has declined steadily since. All the evidence we have seen paints the picture that the largest uses of oil will be in decline in the near future. Likely in response to viewing the same data, the Rockefeller Family Fund, among many others, has divested from fossil fuels. China has announced a plan to invest $361 billion in renewables by 2020. The future outlook for the demand of oil is not particularly rosy. Our investment committee briefly considered divesting from the somewhat oil-linked Master Limited Partnership (MLP) investments, but research with our industry leading managers revealed a more complex picture.

Products from a barrel of crude oil

Implication for MLPs

For years, Equitas has been covering Master Limited Partnerships (MLPs), which are special vehicles to invest in “toll road” income producing pipelines for fossil fuels. While volatile, the Alerian MLP index (AMZ) returned 18.31% for 2016, and has earned an average annual return of 8.05% over the past decade. As of the beginning of 2017, AMZ is earning an annual yield of 6.91% compared to the yields of the REIT index at 3.85% and for the S&P 500 at 2.13%. Even though valuations might change dramatically the income tends to remain stable and increasing due to the toll-road like nature of the transportation contracts. After the drop in oil, the MLP segment of the sector has rebounded more quickly.

MLP yield comparison

These statistics are great, but they would mean relatively little if they depend on the continued flow of oil throughout the US. Luckily, the pipelines are relatively versatile, and able to adapt to ever changing market forces. Over the past 15 years, natural gas and natural gas liquids has doubled from producing 15.9% of our energy to producing 32.8% of our energy. Natural gas is not only a far cleaner energy than oil (emitting 50% less carbon dioxide), but it’s also more economic. Natural gas usage continues to be on the rise not only for industrial uses, but also as a fuel for fleet transportation including companies like FedEx and UPS among many others.

Natural gas share of US energy over time

As our research suggests, the future supply and demand dynamics for oil are not positive. While this is likely to play out over years rather than overnight, we feel safer being ahead of the trend by avoiding concentrated investments in oil. However, with increasing usage of natural gas in the industrial sector, MLPs are positioned to profit. While any investment comes with its risks and requires ongoing monitoring, our extensive research into the fundamentals of MLPs has given us comfort to invest in managers in this sector.

Market Update

Part of our work at Equitas includes staying up to date on the latest research from top managers on Wall Street and across the nation. After the latest due diligence trip to New York City, only one short week passed before the second Presidential Debate dominated the entire news cycle. To my great disappointment, the candidates spent most of the time on personal issues, and relatively little on what we view to be the most important topic: the American Economy and Investment Outlook. While most of us cannot have any real effect on the political landscape, hopefully some of the research covered can help our clients and readers prepare for the upcoming investment landscape, regardless of the outcome of the election.

Macro Themes

Our research process begins with two vital components: a projection of macro themes we expect to be realized in the next 1-3 years, and how we expect investors to react to these macro themes.

Our current Macro Themes for the near term include: the oil market continuing to stabilize, the US economy continuing to improve, and the rest of the world continuing to struggle.

Rough Seas Behind Us

The end of 2014 and most of 2015 delivered a few sharp blows to the US Economy. A global supply/demand disruption in energy and commodity prices shocked those sectors of the market (roughly 10% of the economy), and investors priced in a massive appreciation in the price of the dollar as our growing economy began signaling the end of Zero Interest Rate Policy from the Federal Reserve.

Although the supply of oil increased massively through 2015, rumors of OPEC production deals are beginning to surface. Additionally, global demand is finally showing signs of rising to meet current supply. Based on current consumption and production trends, we expect prices and economic activity to finally stabilize and show signs of tepid growth. Despite being rocked by the oil shock, and other shocks from abroad, US fundamentals from the labor market to corporate growth continue to show robust signs of life.

The side chart shows that the US dollar (DXY) moved from near 80 to near 98 as of mid-October. This represents a 22.5% increase in price for all US goods shipped abroad. As we have covered in previous KnowRisk letters, the companies in the S&P 500 earn roughly 45% of their revenues from abroad. This means that overseas revenues since 2014 have been much more expensive to generate. Absorbing two blows this large is no easy matter, yet the S&P 500 still managed to close 2015 with a modest gain of 1.40%. In 2016, the S&P 500 has thus far earned 7.84% with 3 months still left to go. The only lingering issues are several years of inflation growth below the 2% target, and the labor market only beginning to reach a level resembling full capacity.

Signs of Life Ahead

Despite the headwinds of oil and the dollar, US companies managed to maintain earnings and the S&P 500 index stayed slightly positive in 2015 for the year as a whole. As a counter-balance to the short term shocks, the US economy’s fundamental trends of rising wages and low debt remained robust. Median household incomes rose 5.2% to $56,516. Although wages are still lower than they were at the peak of the tech boom or pre-financial crisis, the growth is faster than it’s been since the 90’s. Broader economic fundamentals (from the unemployment rate to the number of people voluntarily quitting their jobs) are also signaling bullish times ahead.

While consumption is still near 70% of all GDP, it’s also important to remember that the resources that fuel that consumption are generated by private sector earnings. The chart of earnings projections below delivers good news in this regard. Absent any further negative shocks to the economy, earnings for 2017 are primed to rise for the first time in 2 years from ~120 to ~130. The bad news is that shocks are unpredictable, and have seemingly been more frequent.

S&P 500 earnings projections, 2015–2017

Another positive sign for the economy regards our level of debt. Corporate balance sheets are cleaner than they have been in decades, and household debt to income has also returned to a manageable level. Lower, more manageable levels of debt mean that companies and households are less susceptible to temporary downturns in the underlying economy. The US is no longer so fully leveraged that a slight stumble could have disastrous results.

Corporate and household debt-to-income trends

Outlook

Given that growth has been slow, inflation has been low, and we are still dealing with a slightly depressed labor participation rate, we expect that Janet Yellen, Chair of the Federal Reserve System, will allow the economy to “run hot” for a while before raising rates in earnest. She will likely remain in the background until the election is over, but we might see a small rise before the end of the year if the economy posts larger than expected numbers. If earnings, wages, and the general economy continue to progress without interruption, we expect the environment to be appropriate for 2 small raises next year, with plenty of opportunities for re-evaluation. As the American Household/Consumer continues to experience wage growth, we expect lending and consumption to pick-up, feeding a potential “melt-up” situation over the medium term if rates are left unmanaged.

Potential Pitfalls

No picture would be complete without mentioning areas of concern. The timing and intensity with which the Fed acts could have a major impact on growth and recession risk. For example, if the Fed decides to raise rates too quickly, the economy might lose confidence and stumble in a Japan style prolonged recession. Alternatively, the economy might heat up too quickly, causing the Fed to raise rates too sharply in response, which could also rock the markets. Responding too early, or too late with too much vigor, could certainly cause a pullback and increased volatility. The possibility of another shock from abroad also looms large as foreign markets still struggle with negative interest rates. Additionally, we have to weigh the continued impact that the Volker Rule has delivered to markets. This rule has all but removed proprietary trading desks from large banks, along with their ability to act as a market maker. Many investors have decried this rule for removing liquidity and increasing volatility in the markets. We find it hard to disagree, but we have also noticed how this volatility increases the benefits of regular portfolio rebalancing. Absent any extraordinary event and regardless of election outcomes, we may see tailwinds arriving for the American economy.

Exponential Age: The New Industrial Revolution

Singularity University is a Silicon Valley think tank that offers educational programs and a business incubator. It was founded in 2008 at the NASA Research Park in California and is supported by NASA and Google. According to its website, Singularity University focuses on scientific progress and “exponential” technologies. As technologies continue to advance, they accelerate the progression of seemingly unrelated technologies, exploding what is possible at a pace that’s difficult to fathom. This helps redefine what is possible today, and in our rapidly approaching tomorrow.

One of the founders of Singularity University is Ray Kurzweil, one of the world’s leading inventors, thinkers, and futurists, with a thirty-year track record of accurate predictions. Kurzweil was selected as one of the top entrepreneurs by Inc. magazine, which describe him as the “rightful heir to Thomas Edison.” Bill Gates says: “Ray Kurzweil is the best person I know at predicting the future of artificial intelligence.” The other founder is Dr. Peter Diamandis, the SU Executive Chairman who attended MIT where he received his degrees in molecular genetics and aerospace engineering, as well as Harvard Medical School where he received his M.D.

The Exponential Conference Series takes Singularity University’s unique vantage point and focuses it upon the exponentially accelerating technologies that are impacting industry such as Finance, Medicine, Healthcare, Education, Manufacturing, and food. This goes beyond just the effect of Moore’s Law. The next generation of business leadership needs to be able to navigate these progressive changes and disruptive events faster and more effectively than any time in the past. The creative destruction of capitalism goes up by powers of ten when it goes exponential. Udo Gollub from Berlin, Germany recently attended the Singularity University Summit and wrote some observations. Note that these are all extrapolations of exponential technology trends by Singularity University. Nothing here is definitive and everything is in flux. This paper is just to motivate and stimulate thinking and uses some of the key points from the Summit.

In 1888 George Eastman founded Kodak. In 1998, Kodak had 170,000 employees and sold 85% of all photo paper worldwide. Within just a few years, their business model disappeared and they went bankrupt. What happened to Kodak will happen in a lot of industries in the next 10 years — and most people don’t see it coming. Did you think in 1998 that 3 years later you would never take pictures on paper film again? Yet digital cameras were invented in 1975. The first ones had poor quality of only 10,000 pixels, but the technology followed Moore’s law. So as with all exponential technologies, it was a disappointment for a long time, before the technology advanced enough to gain mainstream acceptance in only a few short years. It will now happen with artificial intelligence, healthcare, transportation, energy, education, 3D printing, agriculture and jobs. Welcome to the New Industrial Revolution. Welcome to the Exponential Age.

Information technology grows in an exponential manner. It’s not linear, although our intuition is. When we hunted the savanna millennia ago, we made linear predictions where that animal would be and where to throw our spears. That worked fine back then, and linear thinking became hardwired in our brains. However, the pace of exponential growth better describes the path of information technologies. The difference between the two rates of growth becomes HUGE after a short while.

If you take 10 steps linearly — one, two, three, four, five — you get to 10. If you take 10 steps exponentially — two, four, eight, sixteen — you get to a 1024. If human steps are about one yard, 1024 is about half a mile. If you take 30 steps linearly, you have gone 30 yards. If you take 30 steps exponentially, you hit a billion, which would reach the moon and back! (1 yard steps X 1B = 568,181 miles. Distance to moon is 250,364 miles.) It makes a huge difference, and that describes what is happening in information technology.

A generation ago students at MIT all shared one computer that took up a whole building. The computer in your cellphone today is a million times cheaper, a million times smaller, and a thousand times more powerful. That’s a billion-fold increase in capability per dollar that we’ve actually experienced. And we’re going to do it again in the next 25 years. Information technology progresses through a series of S-curves where each one is a different paradigm. One of the gages of the speed of technological advancement is “Moore’s Law”. Per Wikipedia: “Moore’s law is the observation that the number of transistors in a dense integrated circuit doubles approximately every two years”. Moore’s Law was not the first paradigm to bring exponential growth to computing. The exponential growth of computing started decades before Gordon Moore was even born. And it doesn’t just apply to computation. It’s really any technology where we can measure the underlying information properties. People ask: “What’s going to happen when Moore’s Law comes to an end?” (Which the University says will happen around 2020) We will then go to the next paradigm. In the 1950s, technology was shrinking vacuum tubes, making them smaller and smaller. They finally hit a wall; they couldn’t shrink the vacuum tube anymore and keep the vacuum. And that was the end of the shrinking of vacuum tubes, but it was not the end of the exponential growth of computing. We went to the fourth paradigm, transistors, and finally integrated circuits. When that comes to an end we’ll go to the sixth paradigm: three-dimensional, self-organizing, molecular circuits.

Software will disrupt most traditional industries in the next 5-10 years. Uber is just a software tool, they don’t own any cars, and are now the biggest taxi company in the world. Airbnb is now the biggest hotel company in the world, although they don’t own any properties. This disruption will create large growth opportunities as well as dangerous pitfalls. Be prepared for both.

Artificial Intelligence

Artificial Intelligence

Computers become exponentially better in understanding the world. This year, a computer beat the best Go player in the world, 10 years earlier than expected. In the US, young lawyers face difficulty getting jobs because you can get legal advice from IBM Watson within seconds, with 90% accuracy compared with 70% accuracy when done by humans. So far it is for more or less basic stuff, but if you study law, SU suggests you stop immediately. There will be 90% fewer lawyers in the future, only specialists will remain. Watson already helps nurses diagnosing cancer, 4 times more accurate than human nurses. Watson may be the key to the development of “Robo Advisors” in the financial services industry. Facebook now has a pattern recognition software that can recognize faces better than humans. Singularity University predicts that by 2030 computers will become more intelligent than humans. A new chip some call the “Virtual Processing Unit” or VPU is so powerful that it has the ability to performing up to 8 trillion tasks per second and create entire digital worlds faster than the speed of thought.

Autonomous Cars

Autonomous Cars

In 2018 the first self-driving cars will appear for the public. My Tesla will already drive me to Baton Rouge with its self-navigation system. Around 2020, the complete auto industry will start to be disrupted. The Mercedes InMotion F015 is pictured on the right. You won’t need to own a car anymore. You will call a car with your phone, it will show up at your location, and drive you to your destination. You will not need to park it, you only pay for the driven distance and can be productive while driving. Our kids will never get a driver’s license and will never own a car. It will change the cities, because we will need 90-95% fewer cars for that. We can transform former parking space into parks. 1.2 million people die each year in car accidents worldwide. We now have one accident every 100,000 km, with autonomous driving that will drop to one accident in 10 million km. That will save a million lives each year. Like Kodak, most car companies may not make the transition and become bankrupt. Traditional car companies will try the evolutionary approach and just build a better car, while tech companies (Tesla, Apple, Google) will do the revolutionary approach and build a computer on wheels. The engineers from Volkswagen and Audi are terrified of Tesla.

Insurance Companies will have massive trouble because without accidents, the insurance will become 100X cheaper. The car insurance business model will change or disappear. However, if accidents go down 100X, but the cost to purchase insurance only goes down 50X, the business may become more profitable. Real estate will change because if you can work while you commute, people will move further away to live in a more beautiful neighborhood.

Electricity

Electric cars won’t become main stream until 2020. Cities will be less noisy because all cars will run on electric. Electricity will become incredibly cheap and clean: Solar production has been on an exponential curve for 30 years, but you can only now see the impact. Last year, more solar energy was installed worldwide than fossil. This represents a smooth doubling every two years of the amount of solar energy we’re creating, particularly as we’re now applying nanotechnology, a form of information technology, to solar panels. And we’re only eight doublings away from it meeting 100 percent of our energy needs. And there is 10 thousand times more sunlight than we need. The price for solar will drop so much that all coal companies may be obsolete by 2025.

Water

Water

With cheap electricity comes cheap and abundant water. Desalination now only needs 2kWh per cubic meter. We don’t have scarce water in most places, we only have scarce drinking water. Imagine what will be possible if anyone can have as much clean water as he wants, for nearly no cost.

Health

Health

The Tricorder X prize will be announced this year. QUALCOMM is sponsoring a $10 million competition to bring healthcare to the palm of your hand. There are already 312 pre-registered teams from 38 countries that are competing to build a medical device (called the “Tricorder” from Star Trek) that works with your phone. It takes your retina scan, your blood sample, and you breathe into it. It then analyses 54 biomarkers that will identify nearly any disease. It will be cheap, so in a few years everyone on this planet will have access to world class medicine, nearly for free. The first completed X prize was the $10 million Ansari X prize awarded for the creation of a safe, reliable, reusable, privately-financed manned space ship to demonstrate that private space travel is commercially viable. The prize went to the Mojave Aerospace Ventures team, led by famed aerospace designer Burt Rutan, with financial backing from Microsoft’s Paul Allen. The winning technology was licensed by Richard Branson to create Virgin Galactic. The prize competition itself launched a $2 billion private space industry.

The amount of DNA data we’ve sequenced has doubled every year. The cost has come down by half every year. And this has been a smooth progression since the beginning of the genome project. And halfway through the project, skeptics said, “Well, this is not working out. You’re halfway through the genome project and you’ve finished one percent of the project.” But that was really right on schedule. Because if you double one percent seven more times, which is exactly what happened, you get 100 percent. And the project was finished on time.

There are about 20 regions of the brain that have been modeled, simulated and tested: the auditory cortex, regions of the visual cortex; cerebellum, where we do our skill formation; slices of the cerebral cortex, where we do our rational thinking. And all of this has fueled an increase, very smooth and predictable, of productivity (GDP). Fueled by this information technology, we’ve gone from 30 dollars to 130 dollars in constant dollars in the value of an average hour of human labor. Charlie Munder of Berkshire Hathaway states that productivity in the USA has gone up 6X in his lifetime.

3D Printing

3D printing

The price of the cheapest 3D printer came down from $18,000 to $400 within 10 years. In the same time, it became 100 times faster. All major shoe companies started 3D printing shoes. Spare airplane parts are already 3D printed in remote airports. The space station now has a printer that eliminates the need for the large number of spare parts they used to have in the past. At the end of this year, new smart phones will have 3D scanning possibilities. You can then 3D scan your feet and print your perfect shoe at home. In China, they already 3D printed a complete 6-story office building. By 2027, 10% of everything that’s being produced will be 3D printed.

Business Opportunities

If you think of a niche you want to go in, ask yourself: “in the future, do you think we will have that?” and if the answer is yes, how can you make that happen sooner? If it doesn’t work with your phone, forget the idea. And any idea designed for success in the 20th century is doomed in to failure in the 21st century. There is an app called “moodies” which can already tell in which mood you are. By 2020 there will be apps that can tell by your facial expressions if you are lying. Imagine a political debate where it’s being displayed when the politicians are telling the truth, and when not.

Work

70-80% of jobs will disappear in the next 20 years. There will be a lot of new jobs, but it is not clear if there will be enough new jobs in such a small time. Incoming freshmen at SMU are taught that after graduation you may not go find a job; you may have to go make a job.

Agriculture

Agriculture

There will be a $100 agricultural robot in the future. Farmers in 3rd world countries can then become managers of their field instead of working all days on their fields. Aeroponics will need much less water. The first Petri dish produced veal is now available and will be cheaper than cow-produced veal in 2018. Right now, 30% of all agricultural surfaces are used for cows. Imagine if we don’t need that space anymore. There are several startups that will bring insect protein to the market shortly. It contains more protein than meat and will be labeled as “alternative protein source” (because most people still reject the idea of eating bugs).

Fiat Currency

Bitcoin

Bitcoin will become main stream this year and might possibly become the default reserve currency in the future. Last year Western Union averaged $282 M in wire transfers per day. Bitcoin averaged $171 M. In June of this year, the market cap of Bitcoins eclipsed the market cap of Western Union stock. Should the inscription say: “In Encryption We Trust?”

Longevity

Longevity

Right now, the average life span increases by 3 months per year. Four years ago, the life span used to be 79 years, now its 80 years. The increase itself is increasing and by 2036, there will be more than one year increase per year. So we all might be able to live healthy lives for a long, long, time, probably way more than 100 years.

Education

Education

The cheapest smart phones are already at $10 in Africa and Asia. By 2020, 70% of all humans will own a smart phone. That means everyone has the same access to world class education. Every child can use an online academy for everything a child learns at school in First World countries, so that within a year children in Africa can become fluent in English.

It is a fast moving world and getting faster. There will be both opportunities and pitfalls along the way. The next generation of business leadership needs to be able to navigate these progressive changes and disruptive events faster and more effectively than at any time in the past. We note again that these are all extrapolations of exponential technology trends made by the Singularity University of California. Nothing here is definitive and everything is in a state of change. The purpose of a think tank is to motivate and stimulate thinking. We hope this paper helps accomplish that goal.

Welcome to the Exponential Age.

The Great Divide – Passive vs. Active

A Market with FANGs

A recent Wall Street Journal article addressed the significant change in 2015 from actively managed funds to indexing. For the first time since the 2008 financial crisis, the industry saw an outflow from professionally managed mutual funds. According to Morningstar, in 2015 active funds saw an outflow of $207 billion while their passive counterparts saw a gain of $413 billion. This suggests that not only was new money pouring into index funds, but also many actively managed funds were liquidated to further increase indexed investments. The trend is prevalent in both equity and fixed income.

Is There a Right Answer?

Are the days of money managers numbered? Alternatively, was the herd shifting in 2015 a signal that stock selection will again reign supreme in the coming years? There are trillions of dollars in active management, and trillions in passive management. There is no clear “right or wrong.” We see advantages and disadvantages of both and believe making informed and educated decisions on the correct path for a specific pool of assets is the most important issue.

It is vastly publicized that active managers cannot consistently outperform their passive indexes. Not even Warren Buffet has a perfect record against the market. However, his fund has vastly outperformed the market over time. Is annual outperformance the key, or is cumulative performance more important?

In a recent study of this topic, Equitas examined historic performance over a 10 year cycle of active U.S. equity managers’ net returns vs. the S&P 500 index with no fee. (You cannot invest directly into an index and an index fund would have some small fee included.) While the study did not look at multiple rolling 10 year cycles, the time frame we choose during this decade should have, for the most part favored the index. We used the ten years from January 1, 2004 until December 31, 2013. This time frame avoids the great tech bust years of 2000-2003 but does include the financial crisis of 2008. In the exhibit below we list the annual returns for the S&P 500 for each year, follow by a cross section of popular actively managed funds. A few directly compare to the index and a few are designed to be more balanced funds, typically reflecting lower but less volatile returns.

Annual returns for the S&P 500 versus a cross section of actively managed funds, 2004-2013

If we subtract the index performance from every manager, this leaves us with each manager’s excess return. With this, we can determine the number of successful years active managers outperformed the index. As you will see, not a single fund consistently beat the index over the ten year time frame. In fact, the “batting average” is less than 50% for some of the funds. Looking at this metric, indexing seems to demonstrate very positive characteristics as a consistent investment alternative.

Number of years active managers outperformed the index

Let’s view these comparisons from a different perspective. What is the cumulative return on investment for the index and each of the funds? Take a look at the cumulative return table below. In this review the index fared poorly compared to the active managers. Investments in any of the active managers outperformed the index over the entire 10 year period, although some only half of the calendar years.

Cumulative 10-year return comparison between the index and active managers

Full Universe

This was somewhat surprising considering the annual “misses” of the group so we asked our analysts to evaluate the entire universe of funds for this time frame. Our research criteria was as follows: We excluded all bond funds, high yield/bank loan funds, international and emerging market funds, preferred stock, alternatives and money markets from the Morningstar universe, but counted every share class net of all expenses from the highest expense ratios to the lowest and included all the index funds. The filtering process produced 8,049 funds with a track record covering this 10 year period. The number of funds that outperformed the index was 4,170 or 52% (and these results contain all the index funds). This number is significantly larger than most investors expect and suggests that many active managers can add value to a portfolio over time, if the managers are given time, but will not beat the market yearly.

Why Have Active Managers Underperformed Lately?

The market in 2015 was incredibly concentrated. In a market of mostly losers, a small group of four stocks — Facebook, Amazon, Netflix, and Google (known as the FANGs) — averaged returns of 83%. Removing these four very large companies from the index would drop the return from a barely positive 1.38%, into negative territory. This is important because good active managers typically practice diversification. They avoid being over-exposed to certain sectors or individual stocks. In the vast majority of market environments, this reduces risk. However, in 2015, active managers who were underweight these major companies were bit by the FANGs.

Performance of the FANG stocks in 2015

In 2015, the FANG stocks increased in price for largely technical reasons (namely momentum), as opposed to fundamental reasons (earnings). For example, Netflix ended the year with a Price/Earnings ratio (a measure of how “expensive” a stock is compared to its earnings) over 400 while the broad market ended with a P/E of 18.

In 2016 however, the reversal of this momentum trade has thus far helped push markets even further down as Netflix alone has dropped nearly 25% so far in 2016. Going back 20 years, the P/E ratio of the total market has ranged between 12.5 and 30. The recent market pullback has been mostly valuation based, as the average P/E of the market has dropped from 18.25 to 16.43 today. The last time the market was this cheap was after 3rd Quarter 2013. Then, the S&P 500 charged upwards nearly 400 points from 1,681 to 2,067.89 by the end of 1st Quarter 2015. Since then, markets have remained in the current choppy environment.

Conclusion

There is no clear cut right or wrong answer to the active/passive debate. Based on the market environment, the index ranking in the money manager universe swings back and forth and may be in the 15th percentile, or the 85th percentile. This means that at times the index beats 85% of the active managers, and other times 85% of active managers beat the index.

Active managers can more easily play defense in times of market turmoil, but passive indexes are hard to beat in strong markets. Passive management carries little cash and is usually cap weighted, meaning the returns can be influenced by the concentration of the largest companies in the index such as the FANGs. Active managers often carry some cash and tend to be more equally weighted; limiting the risks and at times the benefits of a concentrated portfolio. Passive management also avoids the risk of manager selection or picking the wrong active manager. For board of directors benchmarking investment returns annually against an index, the passive approach should keep them close to those benchmarks less the internal expenses of the passive funds. This approach has less tracking error and is the best for investors who want more predictability in terms of relative performance to an index, or investors that do not want to take the additional risk of picking a manager who may or may not outperform the index. For investors focused on cumulative growth over longer-term time horizons, and who can tolerate the inevitable periods of underperformance, active managers can play a valuable role in portfolio construction. They do have the potential to outperform an index and make more money over time, like Warren Buffett. However, Buffett has experienced times (like 1999) when he has been 50 percentage points (5,000 basis points) behind the S&P500. Would that bother you?

Buffett is a good example of the use of both active and passive management. The Oracle of Omaha is arguably one of the best active managers in history and does not approach investing passively. Yet, he recommends that most investors should invest in passive index funds! Why is that? Is this a double standard? Well, in a way, yes there is a double standard. Buffet understands that certain investors have the knowledge and inclination to embrace an actively managed approach to investing, but many others do not.

Buffett recognizes that neither approach is wrong and it depends on the nature of the investor. Human nature has shown that most people make decisions driven by emotion. Investors often “zig” when they should “zag”. Many investors may be more inclined to invest in an environment that offers higher levels of predictability, and therefore, should invest in index funds. Index investing removes the possibility of self-inflicted mistakes and lets the general market make you money over time without all the uncertainty of active investing.

Which type of investor are you?

Sovereign Wealth Funds and Declining Markets

Investors are facing stiff challenges as 2016 opened with a bang. Actually, more like an explosion… of selling; as if someone flipped a switch at the end of 2015 and released an onslaught of angry bears. There has been much press early this year about the potential for a record negative January to start the year. While markets are often emotional, fundamentals did not change just because we moved the time clock up a notch.

The simple question everyone is asking is, “Why?” If you look at the standard answers in the media and from many in the financial world you will see the same explanations: China growth uncertainty, extensive declines in oil and commodity prices, the Federal Reserve tightening, global geopolitical uncertainties, and a number of additional irritants like the strength of the US dollar, problems in Emerging Markets, slower recoveries than anticipated, potential additional interest rate hikes by the Federal Reserve and fair valuations for our equity markets. While these all have some relevance, they were as evident in December as they are now. So why the big selloff to start this year and where do we go from here?

Our View

Financial markets are examples of the pure economic laws of supply and demand. While there is always a buyer for every seller, the price that is paid for an asset reflects the willingness of both sides to establish an acceptable value. In the month of January, there has been significantly more willingness by the sellers to part with assets at any price. Volume has been extremely high and markets have been unusually linked to oil prices even though, in theory, low energy prices offer valuable cost savings and should be beneficial to many other industries. This disconnect could be a clue as to what is actually happening to open 2016.

Many of the major oil producing countries have very high social welfare costs. In other words, they provide significant benefits to their populace. These have historically been funded by the sale of oil. In fact, for years they enjoyed excessive revenue flows and placed those excess reserves in Sovereign Wealth Funds. According to Sovereign Wealth Fund Institute, Sovereign Wealth Funds held approximately $7.1 trillion dollars in assets as of March 2015 with over $4 trillion from the oil producing nations. Norway, Abu Dhabi, and Saudi Arabia lead the pack with between $800 and $600 billion each. To put that in perspective, according to the World Bank, $7.1 trillion is larger than the total value of any single stock market in the world except the United States and is larger than the combined values of the markets in Germany, France and the United Kingdom. So what would happen if a country’s declining oil revenue cannot fund their domestic obligations? Perhaps, tapping their “rainy day” sovereign wealth fund is the answer. This would create huge imbalances in the normal supply and demand curves and drive financial asset prices down. It also would connect the short term movements of oil with the significant indiscriminate declines in the global equity markets that should benefit from cheaper oil.

If oil prices remain low and Sovereign Wealth Funds continue to be forced to indiscriminately liquidate from time to time to deliver promised benefits to their populaces, we could see occasional bouts of volatility that will drive financial assets to very attractive levels and could cap stock market valuations.

CIA World Fact Book — Saudi Arabia

As an example from the CIA World Fact Book, Saudi Arabia has an oil-based economy with strong government controls over major economic activities. It possesses about 16% of the world’s proven petroleum reserves, ranks as the largest exporter of petroleum, and plays a leading role in OPEC. The petroleum sector accounts for roughly 80% of budget revenues, 45% of GDP, and 90% of export earnings. In 2014 the Kingdom ran its first budget deficit since 2009, and faces budget deficits for the foreseeable future because it requires an oil price greater than $100 per barrel to balance its budget. Although the Kingdom can finance high deficits for several years by drawing down its considerable foreign assets or borrowing, it probably will begin to reduce capital spending if oil prices stay low through the next year. However, the combined selling from the sovereign wealth reserves from all of the oil producing nations can constitute significant selling pressure in all sectors of global stock and bond markets.

Saudi Reserves of Foreign Exchange: $660.1 billion (31 December 2015 est.); $732.4 billion (31 December 2014 est.)

Saudi GDP (purchasing power parity): $1.61 trillion (2014 est.); $1.556 trillion (2013 est.)

World production and consumption of oil has remained surprisingly firm the last four years as seen in this JPMorgan table. The oversupply for the last three years is estimated to total 3.1 million barrels per day. The resulting oil price fluctuation is surprising.

Deflation Risk

Declining commodity prices, the global strength of the dollar, and the slowdown in the growth of the second largest economy in the world, China, could bring on the risk of worldwide deflation. Even the most seasoned financial professionals have never had to manage through a deflationary cycle. The biggest deflationary cycle of our history was the 1930s following the Great Depression. But that was demand driven deflation where we had major unemployment and lacked the resources to purchase goods and services causing prices to decline. Today, we have strong employment in the United States and improving employment in Europe. We are 7 years out of the Great Recession caused by the financial crisis and our economy is strong and corporate America even stronger. China has been the driver behind the commodity boom and companies expanded production of raw materials to meet the demand. China is now overbuilt and the huge demand has slackened causing supply surpluses that have placed significant pressure on the price curve creating a potential deflationary pricing scenario. This potential deflationary cycle could also be evidenced by the low yields on fixed income assets. If not deflation, we could certainly see a long-term cycle of low pricing. We have only lived in inflation but there have been long cycles of lower prices in our country, all of which, unlike the 1930s, were not damaging to the economy.

Building a Portfolio in a Deflationary Economy

Managing through a market of low or no inflation and consequently, slower corporate growth, could mean a repricing of financial assets that would deliver lower future growth prospects. If we have periods of deflation, say -2%, a 10 year treasury yielding 2% would be a 4% real rate of return since each dollar would buy 2% more goods and services. A rise of 5% in equities would be reflective of a positive 7% return adjusting for that same -2% deflation.

In this environment we would continue to favor conservative equity positions with strong balance sheets and attractive embedded returns in the form of rising dividends. This approach delivers real return annually without regard to price appreciation and offers some downside protection through the dividend yield. Industries and companies that can grow their businesses through increased demand such as health care or technology could also offer attractive metrics.

While fixed income returns should be limited and rates perhaps more suppressed than most of the world anticipated a couple of years ago (including us), intermediate term maturities could provide a measure of defense as well as small positive returns.

Pessimism Is Popular

An explosion rocks the Syrian city of Kobane during a reported suicide car bombing by the Islamic State, as seen from the Turkey-Syria border, on Oct. 20, 2014. The small picture is very bad, but the big picture of violence around the world is about as good as it’s ever been. Photo by Gokhan Sahin/Getty Images.

It is a popular time to be a pessimist and there’s plenty of bad news going around. ISIS, Crimea, Donetsk, Gaza, Burma, Ebola, school shootings, campus rapes, wife-beating athletes, lethal cops — who can avoid the feeling that things are falling apart? Last year Martin Dempsey, chairman of the Joint Chiefs of Staff, testified before a Senate committee that the world is “more dangerous than it has ever been.” This past fall, Harvard Professor Michael Ignatieff wrote of “the tectonic plates of a world order that are being pushed apart by the volcanic upward pressure of violence and hatred.” Two months ago, the New York Times columnist Roger Cohen lamented, “Many people I talk to, and not only over dinner, have never previously felt so uneasy about the state of the world. … The search is on for someone to dispel foreboding and embody, again, the hope of the world.”

Based on social media and television news reports, multitudes perceive that the world is growing worse. You can hear it in the checkout lines, sports stadiums, and in the pews of our local churches. Multitudes are convinced that the world is presently in “freefall” and it’s only a matter of time before everything falls apart. Is this true? Is evil actually growing throughout the earth? Is humanity descending into greater chaos, violence, and destruction?

There is absolutely no evidence of this. By every measurable standard, life is improving around the globe. War and violence are fading and peace is truly taking root. This statement isn’t just a matter of opinion, but a reflection of verifiable statistics.

Annual war battle deaths
Mass killing episodes over time

War and Violence

One way that the world is improving is through the diminishment of violence and brutality. Despite what is suggested by the media, violent deaths and bloodshed are currently the lowest ever recorded. Dr. Steven Pinker, Pulitzer prize-winning author and Harvard psychology professor noted that “today we may be living in the most peaceful era in our species’ existence.” [1]

Prior to the Second World War, nations were continually in bloody conflict. Many Western European nations initiated war every two to three years. However, since the peak of the Cold War in the 1980s, civil wars, genocides, and terrorist attacks have significantly diminished throughout the world.

Pinker declares: “By any standard, the world is nowhere near as genocidal as it was during its peak in the 1940s, when Nazi, Soviet, and Japanese mass murders, together with the targeting of civilians by all sides in World War II, resulted in a civilian death rate in the vicinity of 350 per 100,000 per year… The trend lines for genocide and other civilian killings, fortunately, point sharply downward. After a steady rise during the Cold War until 1992, the proportion of states perpetrating or enabling mass killings of civilians has plummeted.” [2]

We’re not just seeing a reduction in war and civil conflict, there is also a remarkable drop in homicides and violent crimes around the globe. Pinker writes, “England, Canada, and most other industrialized countries have also seen their homicide rates fall in the past decade. Among the 88 countries with reliable data, 67 have seen a decline in the past 15 years… Rates of rape or sexual assault and of violence against intimate partners have been sinking for decades, and are now a quarter or less of their peaks in the past.” [3]

Archeologists and anthropologists have surmised that over 15% of society died violently in previous centuries. More recently this number has dropped down to 3%. In the Twenty-First Century less than 1% have died a violent or war-related death. [4]

With these surprising developments in mind, Pinker argues that “violence has been in decline for thousands of years, and today we may be living in the most peaceable era in the existence of our species.” [5]

Global homicide rate over time

Pinker acknowledges that many are inclined to dismiss his observations. It contradicts what the news anchors and talking heads have presented. This leads us to believe that there is no more “news” reported today, only someone’s agenda of what they want to express and advance as news. Nevertheless, the data actually reveals that the world is becoming a much safer place. Summarizing his findings, Pinker writes: “The world is not falling apart. The kinds of violence to which most people are vulnerable — homicide, rape, battering, child abuse — have been in steady decline throughout most of the world. Autocracy is giving way to democracy. Wars between states — by far the most destructive of all conflicts — are all but obsolete. The increase in the number and deadliness of civil wars since 2010 is circumscribed, puny in comparison with the decline that preceded it, and unlikely to escalate.” [6]

Sadly, violence and bloodshed remain a part of our world, but it is much less pronounced than it was in previous eras. The world is clearly getting better. While many Americans are busy yelling and screaming about their perception of violence, amazing advancements in peace are quietly being established around the world. Even Mexico with all of the much publicized drug cartels, is advancing this trend. The chart below, which has a gap due to data collection issues, demonstrates this.

Ibbotson 90-year market trend

Investing

But the KnowRisk Commentary is about investing! Yes, and this report of the misconception about world violence is a metaphor for what goes on in the investment markets every day. Recent headlines in financial “news” give the impression that another recession is “looming” and even “inevitable.” Are the headlines right? Or is this another case of pessimism gaining popularity?

The Ibbotson graph above shows a 90 year trend that many people forget when media pessimism erupts and misconceived fear takes over. [7]

Emerging markets P/E ratio

In terms of emerging markets, where this crisis began, the Shanghai index has fallen from its peak of 5166 to 3293 as of October 13th (a 36% fall). However, the index is still positive 39% from the previous year to date. For the broader MSCI Emerging Market Index, the P/E ratio (the measure of how “expensive” the market is in terms of what the underlying companies earn) has fallen to 12.5x earnings. With lower values being cheaper, the market is much more attractive now than it was last time the Shanghai index was at this level, in 2009, with a P/E of over 20.

Back at home, if you remove the negative impact from the temporary over-supply of oil, the investment landscape in the US is overwhelmingly positive. The chart below from Deutsche Bank shows that the non-oil linked companies in the S&P have not only held their own, but have grown 9-13%! Thus the 3rd quarter is far from being a signal of an approaching recession. The non-energy sectors appear stronger than ever.

S&P performance excluding oil-linked companies

Most investors cannot see through the misconception and react the opposite way that smart investors like Warren Buffett react. Buffett felt 2008 was a wonderful year to buy stocks at terrific prices. He was right.

Greece and Its Modern-Day Trojan Horse

The past 5 years have presented themselves with turmoil for Greece as it faces an economic crisis not seen since the years after World War II. Plunged deep into a recession, Greece has been in an ongoing debate with the European Union on how to save itself from financial strangulation and economic collapse. What led to the current situation in Greece, and how will this issue be resolved?

How Did Greece Get Into This Situation?

The economic crisis in Greece came to light in October of 2009 after it was discovered that the Greek government deficit figures had been understated. This prompted the European Troika, made up of the European Commission (EC), the European Central Bank (ECB) and the International Monetary Fund (IMF), to develop the initial bailout and eventually a second bailout. These bailouts required Greece to adhere to harsh austerity terms, dividing the public opinion. The austerity terms attempted to address major issues within the government, such as taxation, the state pension system, and the worsening political situation, by cutting state spending.

How Did the First Two Bailouts Work?

Almost six years later, Greece’s government is now sitting upon a total debt of €320 billion (about $350 billion) including two bailouts at €240 billion, equaling 177% of Greece’s annual gross domestic product. The economy has experienced a 25% fall in GDP since the start of its recession, one of the worst falls of an advanced economy since 1870. On 6/30/15, the eurozone bailout for Greece expired and a missed payment to the International Monetary Fund (IMF) of €1.6 billion placed the country in arrears to the organization.

In 2011, Greece collected less than 50% of the taxes owed, and this has not improved in subsequent years. Outstanding undisputed tax debt has only increased, positioning Greece in first place for the highest percent of uncollected taxes in the world. The above statistic does not account for tax evasion, an issue the Greek government also failed to address. This situation fared no better in 2012 and early 2015 when the New Democracy party and, after its dismissal, the Syriza government were elected. Both refused to adhere to the bailout terms laid out by the Troika. The combination of ineffective taxation, refusal to abide to austerity measures and division within the political system for over a decade has pushed Greece into an inevitable economic crisis.

Outstanding undisputed tax debt

So What Is the Current Situation in Greece?

Third International Bailout: On 7/13/15, after 17 hours of negotiation, the eurozone leaders decided to offer a third international bailout of €86 billion over the next three years in exchange for much of the same prior concessions, including pension reforms, public sector spending cuts, and an increase in the value added tax (VAT). This third bailout demonstrates the commitment of European sovereign nations to keep Greece in the eurozone. However, this brings up the question of whether Greece is able to stay in the EU long term? It is urgent that the Greek economy experiences a turn of events. Debt relief is the priority, which is being addressed through the simple strategies of decreasing expenses and increasing revenues. A bridge loan to recapitalize Greek banks should allow the European Central Bank (ECB) to return to Greece’s aid if their efforts are apparent to other European nations. It is clear that Greece would like to stay in the eurozone, and the third bailout presents the chance for the troubled country to demonstrate their willingness.

Future Investments in Greece: Should US investors be optimistic about Greek markets, with the assumption that the country adheres to the new bailout’s terms? In 2014, 33% of S&P 500 companies’ revenues were outside of the US, with 7% of revenues coming from Europe. With the US dollar strengthening relative to the euro, and the foreign revenue for US companies from Europe minimal, investors may lose confidence within the European markets, particularly in a country with an economic crisis. However, there are still investors that see potential investments within Greece. Wilbur Ross, a successful distressed asset investor, put €1.3 billion into Eurobank Ergasias last year, Greece’s third largest bank. It is too risky for our taste.

S&P 500 business outside of the US

Pension Problem: Greece’s pension system has faced much criticism for its unsustainability and requires major reforms. Despite pension benefit cuts, an increased retirement age of 67 to receive full benefits (the lowest being 57 in 2009), and penalties for early retirement, the system has not improved. This only spurred an increase in retirement requests, with workers set to retire within a few years receiving better benefits by retiring early as opposed to continue working. The unemployment rate for the age group of 55-64 years jumped from 6% in 2010 to 20% in 2015. Therefore, Greece still spends 17.5% of its GDP on pensions, the highest of any country within the European Union. Recently, lack of state pension funds has rendered millions of citizens unable to receive their payments and there has been a 35% decline in living standards since the start of the recession.

Implications if Greece Were to Fall Out of the Eurozone: This is the phenomenon known as the “Grexit.” Could exiting the eurozone be beneficial for Greece? Although unlikely, it is interesting to discuss the impact if this event were to happen. Since its establishment in 1999, Greece would be the first country to ever exit the eurozone, making it challenging to anticipate the effect this would have. At only 2% of the eurozone’s gross GDP, Greece’s exit from the euro would seem nominal. The issue is that, to avoid Greece defaulting in 2010, bailouts were delivered to prevent the failure of financial institutions that had lent to Greece. Even though it was necessary for Greece to default, this did not happen. If Greece was to default now, European creditors such as the European Central Bank and International Money Fund would lose a tremendous amount of finances. These losses would also drive up borrowing costs for other debtor nations, potentially creating a domino effect that would affect the economies of other European Union nations.

Greece as a tiny part of the eurozone economy

Conclusion

In closing, the decisions that Greece makes in the latter end of this year will largely decide its economic future. While we cannot know how the nation will handle this situation, history often repeats itself, and it is likely that Greece will default on their debt payments again unless major changes are implemented. The effects of the Greek economic crisis upon itself and the European continent as a whole will become further apparent in the coming months of this year, but Argentina may be an example. Whatever the outcome, Greece on many measures, is all but bankrupt.

“They’ve got the usual Socialist disease — they’ve run out of other people’s money.”
Margaret Thatcher

The current Leftist government will still be paying back the IMF until 2030, and in total, its repayment schedule stretches out over the next 42 years to 2057. The Greek government faces the prospect of becoming the first developed nation to default on its international obligations since WWII. This would be a significant event, and the European Union does not want to play dominos.

Is It Euro € Time?

Many US investors have avoided European markets over the last several years as US markets have surged with a strong dollar while other developed markets struggle. Is it time to take a fresh look at international opportunities? Some evidence suggests that it may be time to take another look at global investing.

Dollar $ vs. Euro €

This story has been building momentum over the past nine months. From 6/30/14-3/31/15, the U.S. dollar surged in value against a basket of major currencies. The U.S. Dollar Index (DXY) rose by 23.3% over that period. While most U.S. investors probably think of a strengthening dollar in terms of its potential impact on the value of any foreign securities they may be holding, there is also the question of how it may impact U.S. stocks, and the U.S. economy. Some investors were paying attention a few years ago when U.S. stocks were rallying off the weakness in the dollar. A report released on 4/10/15 by Citi Research, a division of Citigroup Global Markets, concluded the following about the dollar’s influence on equities: “The dollar generally has not determined stock price direction for the broad market but there is some correlation with large and small caps, though the relationship is not consistent.”

There is a big difference the last 12 months ending February when the EAFE was up 13% in local currency, but with the strong dollar, EAFE was flat in USD. Investors may want to consider indexes or managers who hedge out the currency exposure from their international portfolios to protect against moves like that.

The strong dollar eventually has a self-correcting effect. Cumulatively, international sales account for 30-40% of revenue for companies in the S&P 500. As the dollar strengthens, our goods and services become more expensive globally vs. European competitors; gradually weakening the dollar as demand for Euros rises. There is no alarm that will go off notifying us of the end to this cycle but we can see some evidence. George Soros, a relatively successful forward thinker, recently moved his $2 billion in outside managed hedge funds into European equity — unhedged!

So what are other factors pointing to a more imminent economic expansion in the Eurozone leading to potentially stronger international equity markets?

Brent crude priced in euros

  1. Strong dollar makes European goods and services attractively priced. A weak Euro helps the value of their goods and services as dollar denominated products become much more expensive.
  2. Oil as a catalyst for improved Euro earnings. Most of Europe is a net buyer of oil so lower prices lowers production expenses and improves profits without the offsetting GDP impact of lower profits for natural resource companies like we have in the U.S.
  3. Quantitative Easing by the ECB. Europe is years behind the USA in launching a quantitative easing program. European Central Bank (ECB) President Mario Draghi recently announced the launch of an open-ended, expanded monthly 60 billion euro ($70 billion) private and public bond-buying program. The long-anticipated introduction of euro zone government bond purchases, which could amount to as much as a trillion euros, will mean the ECB will join the U.S. Federal Reserve, Bank of England and Bank of Japan in launching a quantitative easing (QE) scheme. The program will be open-ended, lasting until at least 2016. The hope is that it will boost the region’s painfully low inflation rate, which came in at an annual minus 0.2 percent in December.
  4. Exports as a percent of GDP. Exports play a much larger economic role in the Eurozone than in the United States. According to a 2012 study by the World Bank, exports account for 44.75% of the European economy and only 13.52% in the U.S. This would suggest that a weaker Euro could have a much larger impact on the European economy and perhaps be reflected in improving equity market valuations.
  5. International markets are cheaper than the US market. In the near-term, the rise in the value of the dollar is expected to have some influence on corporate earnings results for Q1’15. Earnings reporting season commenced on 4/8/15. As of the third week in March, nearly 20% of S&P 500 companies had warned investors on their Q1’15 earnings, with at least 49 companies mentioning that the dollar’s strength did influence results, according to Reuters. Wolfgang Koester, chief executive of FiREapps, a foreign exchange data analytics firm, estimated that North American public companies could give up more than $25 billion in revenues in Q1’15, due to currency-related volatility, and that the strong dollar dinged earnings by approximately $18.66 billion in Q4’14. If the dollar continues to rally moving forward, we believe that some companies could move to implement currency hedging strategies to help mitigate the hit to earnings.

MSCI vs. S&P forward price/earnings ratios

As for European markets, the forward P/E ratio for the next 12-month consensus EPS is still lower than that of the S&P 500. On top of this, European stock earnings are still depressed relative to the peak whereas the US has rebounded. With their massive QE still in the early stages, the markets have plenty of upside potential.

Forward EPS estimates

Source: MSCI, FactSet, J.P. Morgan Asset Management. Forward Price to Earnings Ratio is based on each index price, divided by consensus estimates for earnings per share (EPS) in the next 12 months (NTM) and is provided by FactSet Market Aggregates. Past performance is not indicative of future returns. Data are as of March 31, 2015.

While many factors can influence the value of a fiat currency at any given time, such as trade, central bank monetary policy, wars and geopolitical events, investors should always try to keep an eye on the bigger picture. Despite all of the fluctuations in the dollar since 2007, which includes the 2008-2009 financial crisis, global nominal GDP still rose from $57.46 trillion in 2007 to $77.30 trillion in 2014, or an increase of $19.85 trillion, according to the International Monetary Fund. For comparative purposes, nominal GDP in the U.S., which is the world’s largest economy, stood at $17.70 trillion at the close of 2014, according to Bloomberg. World economic output has expanded by an amount larger than the size of the U.S. economy in just the past seven years. That is amazing considering the turbulent times we have experienced.

Global nominal GDP growth, 2007–2014

In closing, while we cannot anticipate the length and strength of currency moves, the Euro has moved into territory that many believe give foreign corporations a meaningful competitive advantage vs. their US counterparts. This advantage could certainly be reflected in top line revenue growth and profitability for European companies. Adding the introduction of Quantitative Easing by the ECB could be a strong catalyst for rising valuations in the European equity markets.

Invest Long Term – Speculate Short Term

“The only function of economic forecasting is to make astrology look respectable.”

Every January, the financial industry and financial media in general appear to be hell-bent on forecasting this or that. The amount of short term forecasts predicting where the S&P will end up in the year ahead is mind-boggling, and quite frankly a little silly. As if anyone who could reliably predict the future would share their secrets!

To exemplify how bad short term forecasting often is, and just how careful one needs to be if relying on short term forecasts to construct one’s portfolio, take a look at the chart below. As the oil price collapse got more and more pronounced during 2014, analysts didn’t change their future price expectations one iota. The 3-month and 12-month forecasts were more or less the same premium over the spot price — the starting point (the spot price) just got lower and lower. Predicting short term oil prices (or anything else for that matter) can be a fool’s game.

Evolution of Brent Oil Price Forecasts (USD per Barrel)

Note: Each line represents the spot price, the 3 month forecast and the 12 month forecast as available on the survey date indicated in the legend. Source: Financial Times, Consensus Economics.

When putting money to work, most people are pretty lousy at short term investing. The only consolation is that you are in good company. It is no big challenge to make short term profits in a bull market, because the rising tide will lift all boats. It is a great deal more difficult to generate a positive return over the short term when the beta is zero or negative.

It is important to distinguish between three time horizons when investing:

  • Very short term (mostly technical factors)
  • Short to medium term (mostly cyclical factors)
  • Long term (mostly structural or fundamental factors)

One of the biggest technical factors is the contrarian indicator. If the entire world is negative on asset x, we see it as a major positive. The logic is simple. The vast majority of people are smart enough to position themselves accordingly before they go public with a view. So, when the entire world is already negative, where is the selling pressure going to come from? The next move can only be on the buy side.

Another major technical indicator is mean reversion, which can be an extraordinarily powerful factor in the industry. If an asset does particularly poorly in one year, it is often near the top the next. So which asset classes performed the worst in 2014? Oil took the prize with Greek and Portuguese equities in close pursuit. A portfolio consisting of those assets would probably do surprisingly well over the next 12 months even if they have few friends at the moment.

Looking at the past, we believe the best results are achieved when investors have focused on structural factors and have looked several years ahead. Why is that?

Many investors genuinely believe that it is impossible to look 5-10 years into the future when investing. Too many technical and cyclical factors are likely to derail their strategy, or so the argument often goes.

The effect of this is overcrowding at the near end, making it all the more difficult to outperform near term, while those of us focusing on the long term operate in a far less crowded space, providing us with a comparative advantage. The added advantage, when focusing at the longer term, is that you often have a greater tolerance for volatility.

What are the structural or fundamental macro-economic trends to follow?

Demographics — The Aging of People in the Mature World

Much has been written about demographics in the past. It is one of the easiest macro-economic trends to fathom. The struggle has only just begun. We live in a time where the number of elderly is about to grow explosively and, while many countries will not experience the peak of the problem until after 2030, you will be mistaken to think that you don’t have to be concerned.

Old age dependency ratios for selected countries

Source: UN

Demographics represent the single most important structural trend that we are faced with today, and it will massively impact everything — economic growth, interest rates, public debt, stock markets, consumer demand, etc. One of the most important repercussions to investors is the effect it will have on our pension systems.

Quite a few European countries will see a substantial increase in the old age dependency ratio between 2020 and 2030. In Germany, for example, it will jump from just under 36% to over 47%. Such a drastic increase in the number of elderly will have a dramatic effect on everything, and it is only just beginning.

In the world of mature economies, the U.K. and the U.S. will suffer the least from aging. Only emerging market countries are in better shape, but don’t assume everything is fine in China. It is actually in a worse condition than both the U.K. and the U.S. At some point the one child per family will have a severe effect on demographics.

Unfunded pension liabilities fast approach £10 trillion in the UK with an annual UK GDP of about £1.86 trillion last year. The size of the liability compared to their total earnings as a country is enormous. Younger people today had better accept the fact that they likely won’t receive the pension entitlements that they have been promised. The government simply cannot afford to pay out at this rate over the next few decades. However, nobody wants to start the politically necessary discussion, as it is most certainly not a popular vote winner, bordering on political suicide.

The Return to Fundamentally Driven Investing

QE has changed the dynamics of investing. The obvious one is fixed income investing, but it doesn’t stop there. Because investors are now earning such low returns on bonds, much capital has been re-directed towards equities (and other asset classes as well), driving valuations higher. Nowhere has this been the case more so than in the U.S. equity market.

Obviously QE will not last forever. The Fed has already more or less ended its program, and although Europe is way behind in the recovery phase (we expect plenty more easing by the ECB in the short term), it will happen eventually. The big question is what will happen to bond prices when central banks are no longer a significant buyer? We still think inflationary pressures will remain very modest, suggesting low interest rates for quite some time to come.

Regardless of this projection, with no QE to beef up prices, at least in the U.S., investors are likely to pay increasing attention to fundamental factors. As we have argued over the past few months, a return to fundamentally driven investing is likely to happen at a time when those fundamentals are not the most promising to have ever come across. We believe that we have entered a period of below average economic growth and therefore also a period of disappointing earnings growth for many companies, limiting the upside potential on shares. However, don’t ignore the earlier comments about the missing connection between economic fundamentals and equity prices in the short term.

We still expect equity returns to be positive over the next several years but, on average, would expect returns to be lower than we have grown accustomed to since the start of the great equity bull market in the early 1980s.

Because economic growth is likely to disappoint, investors should remain only lukewarm on cyclical companies. Investors will almost certainly pay more attention to dividends than they have done in recent years as we have written extensively about the power of dividends several times before.

Given the ‘damage’ QE has done to valuation levels, as the market returns to a more fundamental approach, we can see that a high quality approach to equity investing is working quite well. Likewise we wouldn’t be surprised to see value stocks begin to outperform growth stocks again.

In a World of Managed Interest Rates, Currencies Are the Primary Adjustment Factor

The point is the following: when interest rates are managed (some say manipulated), markets are efficient enough to make the necessary adjustments elsewhere and, in this context, currencies play an important role. If one economy outperforms another (e.g. the U.S. outperforms Europe as is presently the case) but interest rates in both areas remain ‘managed’, the currency of the better performing country will simply outperform the currency of the weaker one (as USD presently does vis-à-vis EUR), in effect doing the job that the bond market would have done under normal circumstances.

Having said that, this adjustment mechanism doesn’t work very well in countries where the bond market is almost entirely controlled by domestic investors to whom changes in the exchange rate won’t have the same behavioral effect, which explains why it has never worked in Japan.

With this in mind, we find it difficult not to maintain a long-term bullishness on USD/EUR, despite the U.S. dollar’s recent gains. Current U.S. economic activity is too high to justify the low level of interest rates over there, and currency markets are likely to make the adjustments that politicians/central bankers are not willing to do.

The End of Cheap Oil

Despite the recent turmoil in global oil prices, nothing has fundamentally changed. The world will still run out of cheap oil (cheap as in approx. $25 per barrel of production cost, as is currently the average production cost in the Middle East) over the next decade or so. It is hard to predict exactly when, because OPEC members are not the most informative people in the world.

Note that it is fundamentally different from the widely acclaimed theme known as Peak Oil, the consequence of which is that oil production will be in terminal decline once production has peaked. Oil won’t run out anytime soon, but the price will be altogether different from the price the world got used to until relatively recently.

U.S. Shale Is Changing the Dynamics of Oil

US shale oil production growth

Source: Econbrowser.com, Vox.com

Following six months of near constantly falling oil prices, you are probably surprised to see this listed in the first place. After the shale (fracking) revolution, how can anyone seriously suggest that energy supplies are dwindling? After years of massive investment, primarily in the U.S., shale has tipped the supply/demand balance.

Take a look at the chart above and pay particular attention to the green line on the extreme right. Most of what is named ‘tight oil’ in the U.S. is shale, and production has risen by almost 4 million barrels per day since 2008. In effect, OPEC is trying to destroy the economics of this industry, which admittedly requires quite high oil prices to remain profitable. However, only 4% of total U.S. shale production breaks even at $80 or higher. A high percentage of the industry breaks even with an oil price in the $55-65 range.

A Significant Excess of Oil Supply Has Opened Up

Global oil supply and demand balance

Source: Vox.com, IEA.org

What happens next is anyone’s guess, though. It is now a highly political chess game and, as we have learned over the years, when politics enter the frame, logic (and therefore fundamentals) goes out the window.

OPEC (with Saudi Arabia in the driving seat) may exhaust itself and decide that enough is enough, or it may go for broke — in this case it would want U.S. shale producers to go bankrupt and exit the industry forever which, we note, is quite likely to happen for some producers, should the oil price stay at current levels or lower for any extended period of time. The U.S., on the other hand, will obviously benefit from lower oil prices despite its growing shale production. Consumers will benefit immensely, as will most of the rest of the country.

A number of U.S.-antagonistic countries around the world (think countries like Russia, Iran and Venezuela) will be seriously weakened as a result of lower oil prices, which will strengthen the position of the U.S. in global politics. At current oil prices, Russia alone stands to lose in excess of $100 billion annually in export revenues — an amount they can hardly afford. Who will give in first? We have no idea.

The long term point missed by most people in this quite fascinating chess game is that even modest changes in the balance between supply and demand can have a dramatic impact on price, provided demand for, and supply of, the commodity in question is inelastic, and that is precisely the case as far as oil is concerned.

The ‘Demise’ of the Consumer-Driven Growth Model

The consumer very much dominates the U.K. as well as the U.S. economy — in fact so much so that it is the consumer more than anything else that dictates the direction of the economy in those two countries. Consumer spending in the U.S. accounts for nearly 70% of GDP, whereas the same number in the U.K. is in the mid-60s. By comparison, in Germany, which is known for its much more restrained consumers (which is not inevitably bad), consumer spending as a % of GDP is only in the mid-50s.

Two dynamics will reduce the impact of the consumer in the developed world over the next several years — demographics (as already mentioned) and debt levels which are worryingly high in the household sector. An economy not so dependent on the consumer is not necessarily a bad thing.

Research from Stanford University:

“It’s not the ‘information’ that counts; it’s a superior interpretation of it that counts.”

Modern efficient market theory claims you cannot legitimately beat the market and add “alpha.” After all, if everyone has the same data and information, then how could any one investor claim to be able to outperform others — except by being lucky or by possessing inside information? Seductive as it is, this claim is incorrect as extensive new research from Stanford University makes clear. For it is possible to add alpha by interpreting commonly available information better than others do. That is, superior inferences from the data can be identified.

Concluding Remarks

The point is quite simply that the smart investor will keep the long term outlook in mind. Our needs are long term, and will be affected ultimately by how structural trends play out. Only by trying to make sense of the long term outlook can we understand how to develop an investment strategy that is fit for the future.

So where does all of that leave us? How will equities perform this year and will interest rates go up, remain the same, or even trend down? As we have stated: no one knows the short term. We can say the following:

We are still in a post-crisis environment, and enough people are still negative on equities, and interest rates are low enough, to provide plenty of purchasing power. We therefore expect it to be an ok period for equities over the next year or two — not outstanding given our modest growth expectations, but ok.

Interest rates will continue to stay relatively low, but the pressure on various central banks — in particular the Fed — to increase the policy rate is rising, and the Fed has already said they expect to begin a cycle of higher rates relatively early this year.

The USD is likely to remain strong throughout the year. The trick is to be careful on emerging markets. If the U.S. dollar continues to be strong, it is an accident waiting to happen.

The star performer this year could very well be the worst performer for 2014… OIL, but expect an exceedingly bumpy road ahead and don’t be surprised if it touches $40 (even $30 is possible) before it resumes its journey north.

Finally, we expect some, but far from all, alternative strategies to perform well in this sort of environment. Rules prevent being more specific in this article, but after many years of lack luster returns, it is possible for a tailwind to return to alternatives.

It is important to remember to distinguish between three time horizons when investing:

  • Very short term (mostly technical factors)
  • Short to medium term (mostly cyclical factors)
  • Long term (mostly structural or fundamental factors)

Behavioral Finance

For most researchers working in neuroscience, the Holy Grail is to discover how to regenerate the neurons of the brain. Such a feat would help scientists put an end to diseases such as Parkinson’s, Alzheimer’s and many forms of dementia. But others are taking the techniques of this growing field and applying them to behavioral finance, itself a mash-up of economics and psychology. The result is a new field called neuroeconomics, which attempts to explain how people manage risk and why they often make irrational decisions.

That emotions play a powerful role is nothing new. Benjamin Graham, considered the father of value investing, once said, “Individuals who cannot master their emotions are ill-suited to profit from the investment process.” But the core theories of the field now known as Behavioral Finance were developed by Daniel Kahneman of Princeton University, whose work, with the late Amos Tversky, won him the Nobel Memorial Prize in Economic Sciences in 2002. Kahneman and Tversky found that people suffer a higher degree of pain from losing money than they feel pleasure from making money. So they tend to hold on to losing stocks rather than sell and lock in a loss.

R.J. Weiss, the 26-year-old founder of the blog Gen Y Wealth, recently posted that he got caught in a behavior trap. When his grandfather passed away, he inherited shares trading at $25. As the shares fell to $20, to $10 and then to $5, Weiss couldn’t bring himself to part with his grandfather’s gift. Finally, in April, he sold at $3.04, locking in a 90 percent loss. “The entire time the stock plummeted, I knew [that holding] was the wrong thing to do. But I couldn’t get myself to sell it,” wrote Weiss. Irrationality can take the form of an emotional attachment to an inanimate asset.

John Coates, a senior research fellow in neuroscience and finance at the University of Cambridge, has a theory. He says there would be fewer stock market bubbles and crashes if women and older men handled most of the trading. “There is less diversity in the financial world than in the military,” he quips. “On Wall Street, we have one slice of the population — young men — running our trading floors. That leads to extreme behavior: They go wilding.” Wilding is not good for stocks. Such behavior likely contributed to the Internet crash in 2000 and the subprime-fueled crash of 2008-2009.

In 2007, Coates went to a trading floor and took repeated saliva samples from 250 traders, mostly young men. He found that in the mornings, when their testosterone levels were high, the traders’ confidence was also high. As they made winning trades, their testosterone levels rose even higher, leading to profits in the afternoon. The young men began to feel infallible, indulging in increasingly risky behavior, such as buying shares of overvalued stocks. But eventually too much testosterone, too much impaired judgment, would drive markets to unsustainable heights. Then the cycle could end. The overvalued stocks would crash and the testosterone levels would return to normal. “Testosterone is the molecule that explains irrational exuberance,” says Coates. “A certain amount of testosterone can be healthy, but too much can lead to a bubble.” A more immediate solution may come from John Coates’s research: adjust the mix of traders to include more women and older men.

Investors with the biggest appetite for risk have increased brain activity in an area called the nucleus accumbens. That’s the part that lights up in an animal when it finds food or in a predator when it goes for the kill. At the same time, there’s a surge in the feel-good chemical dopamine. It floods your brain when you anticipate doing something pleasurable or exciting such as sky diving, listening to music or having sex. A dopamine high can cause investors to engage in risky behavior.

However if going really wild means moving from a three month Treasury bill to a one-year certificate of deposit, you’re probably suffering from Irrational Prudence Syndrome, a non-medical but widespread condition that results from overexposure to volatile markets. IPS is characterized by extreme aversion to equities and uncontrollable urges to stuff cash into government guaranteed mattresses, be it a CD, a Treasury security or even a checking account. It’s a syndrome financial firms dread, and one they are determined to cure. Left untreated, IPS can lead to poorer investors — and frustrated advisers.

Are retail investors’ expectations upside down? High when conditions are bad for investing, low when conditions are good? Is there a better way to anticipate what’s going to happen to your investments? The answer is: yes and yes.

There is ample evidence that popular expectations for investment returns are just about the opposite of what would come from a sober analysis of the fundamental data. In 2000, when the market was trading at absurdly high multiples of corporate earnings, funds holding U.S. stocks hauled in $288 billion. In 2002, when stocks were cheap, the inflow slowed to a $13 billion trickle, then went negative.

The inflow into stock funds dried up once again after the crash of 2007-09 and stayed low for most of the next five years. Now, with stock prices at abnormally high multiples of earnings, the investing masses are again putting big money into stock funds.

It’s the same with high yield bonds. A rational investor would be most likely to buy risky corporate debt when the reward — the yield — is highest and least likely when it is meager. The public is doing just the opposite.

Behavioral Finance

In tumultuous 2008, when high yield bond prices were depressed, their yields averaged a 10% premium over safe Treasury paper. That was a good time to be buying. But retail investors were doing more selling than buying. That year high yield funds saw $6 billion of net redemptions, not counting reinvestment of dividends, according to data from the Investment Company Institute.

Six years later the prices of risky bonds have recovered, and their yields are correspondingly lower. What are investors doing? They should be selling, but they are not. In 2013, when the yield premium on average was only half that of 2008, investors poured a net $54 billion into high yield funds. The money is still coming in ($10 billion in the first four months of this year).

The pattern: if an asset class has done well recently, making its price high, fund buyers want it. If it has done poorly, making it a bargain, they want to sell.

The phenomenon described above anecdotally has been studied statistically. Two Harvard professors, Andrei Shleifer and Robin Greenwood, published a paper last year demonstrating that investor expectations are highest when objective models would say that expected asset returns are lowest, and vice versa.

“People react to salience,” says professor Greenwood. “Recent performance is salient.” That’s a polite way of saying that naive investors navigate with a rearview mirror.

You don’t have to make that mistake. There are better ways to come up with a forecast of future returns than to extrapolate the recent past. Experts can differ about how to come up with an expected return from an asset. But one thing they would agree on is that recent performance is a bad indicator of future results. You shouldn’t be buying an asset class just because it has been going up.

The place to start is with the yield. For a bond, it’s the interest yield. For a stock, it’s the earnings yield, which is the net income divided by the stock price. The fundamental characteristics of an investment may be at odds with the emotional characteristics. Smart seasoned investors stick to the fundamentals.

“Buy at the point of maximum pessimism; sell at the point of maximum optimism.” A committed contrarian, Templeton believed the only way to get a bargain in the stock market was to buy when everyone else was selling: at the outbreak of World War II, when everyone else was panicking, he bought shares in every NYSE-listed company that was trading for less than $1 — and made money on nearly all of them.
Sir John Templeton (1912–2008), Founder, Templeton Funds
“Only invest in what you understand and at the right price. Whether socks or stocks, I like buying quality merchandise when it is marked down.”
Warren Buffett, Chairman & CEO, Berkshire Hathaway
“Information is money.” Thanks to his extensive network of carrier pigeons, Rothschild knew that England had defeated France at Waterloo before anyone else in London. As other traders on the stock exchange braced for a British loss, he went long. Rothschild’s father planted the seeds for the 19th century’s greatest banking empire by stationing each of his five sons in different European cities. Nathan got London, but throughout his career he was able to profit from the insights of his brothers in Frankfurt, Paris, Naples and Vienna.
Nathan Mayer Rothschild (1777–1836), Founder, N.M. Rothschild & Sons

The message for investors is not to “guess” where markets are in the cycle or wait for bottoms to invest or tops to sell since they can be years away. The lessons from these sage investors with their “indispensable wisdom” are not to sell in bad markets and not to try and “time” the market. As John Templeton also said: “It’s not timing the market; it is time in the market that builds long term wealth.”

Buy Low, Sell High or Buy High, Sell Higher?

“The dumbest reason in the world to buy a stock is because it is going up.”
Warren Buffett

Fund managers have different strategies for navigating the ebbs and flows of investing. For Value style investors, it all boils down to one main rule: “buy low, sell high.” The phrase is often quoted, but often abandoned by Growth style investors in favor of another notable phrase: “buy high, sell higher.” While both styles can deliver gains, sometimes investors get swept up with the short term trends and forget the big picture. Over long periods of time, investments tend to reflect the characteristics of each asset class. Over short periods of time, the picture can be skewed or distorted by many factors, including market swings, investor sentiment, government intervention, recessions, wars, etc. Within these swings lies pitfalls and opportunity.

The following graph shows the year to year swings of various asset classes along with the 20 year long term average of each asset class. The long term averages reveal the range of the investment returns, along with the average of that range. Where the market lies within the range has a very dramatic impact on the experience you have as an investor.

Another rule of investing is called “gravitation to the mean” which means that all investments will eventually gravitate back to the characteristic average, often referred to as the “fundamentals” of that investment. The problem with this rule is that there are no market signals to tell you when the timing of this “mean reversion” will happen. This brings up a corollary to this rule, “the market can be irrational longer than you can be solvent.” This is the rule that drove hedge fund manager Julian Robertson out of business in 2000, four months before he would have been proven right.

This was never truer than the high tech boom of the late 1990s. Irrational exuberance over tech stocks sent valuations exponentially higher than their fundamentals warranted. The trend lasted for years before crashing back to earth. The NASDAQ still has not recovered. For the following few years, the trend reversed and the low tech stocks rallied. The previous graph shows four years of international stock outperformance in a row from 2004 to 2007. This momentum continued for four years before going to the bottom of the barrel in 2008.

To get a vision of where an investment category is in the cycle, one can look at the fundamentals of the category. Although dividends are the most visible form of income to the investor, we can go one step further to view the driver of dividends: earnings. Earnings are used as a signal of value in growing companies that do not yet pay a dividend, and earnings are strongly correlated to dividends in dividend paying companies. Based on these fundamentals, the price that one pays for the value of a stock in terms of its earnings can be expressed as a ratio, the P/E ratio. At the time of that KnowRisk commentary, the forward P/E ratio of the equity market was 12 with earnings rising. Since the third quarter of 2012 to present day, the Dow Jones Dividend index is up over 35% to a PE ratio of 17. To get a sense of what lies ahead for US stocks, we can look at future expectations for earnings. As you can see from the below chart, guidance is proving to be less optimistic. The domestic market has all the momentum from 2013 but may need to take a breather which is what has been happening so far in 2014.

Negative earnings announcements

With equity markets taking a bit of breather our first look is to bonds. As we’ve also discussed in a previous KnowRisk entitled Rising Rates, bonds with exposure to US interest rate risk do not have a rosy future for the next few years in this flat to rising interest rate environment. The latest estimates from the Federal Open Market Committee continue to show rate increases beginning in late 2015 and accelerating into the long run. What options, then, are left to the intelligent investor?

A more diversified chart including international stock, commodities, REITs, and splitting stock into the Growth and Value components, produces a graph that looks like the one below. Note that the growth and value styles are both successful, but can have wide performance differentials like the 10 point spreads in 2006 and 2007. Without steady growth and momentum producing a category consistently at the top for the last market cycle we find ourselves in a much different market position than in the 2004 to 2007 run of Foreign Stocks.

With the understanding that market cycles and long term trends shift we would perhaps be best served by looking for value in the investment categories that are at the bottom of return charts. The risk of owning them is often lower the longer they have been the worst performers and historical mean reversion should mean they are perhaps due for a period of stronger returns.

Diversified asset class returns by year

In particular Commodities and Emerging Markets seem to be undervalued. A glance at the Price/Earnings ratios of domestic stocks vs the Emerging Market stocks reveals a differential of 17 vs 12 suggesting that after the big run up in US stocks, the EM companies can be bought cheaper than domestic. The spread in valuations between the two indexes is larger than it has been at any time in the past five years. The “buy low, sell high” investor, will look to these underperforming assets which can be purchased at a better price.

P/E ratio comparison, domestic vs. emerging markets

A look at Commodities in the previous asset class chart shows that they have produced the best returns during the 1st Quarter of 2014. This is after being the worst performing asset class for the three previous years. Perhaps it is the beginning of a period of mean reverting outperformance for Commodities? Perhaps it is a short term positive move in a longer term bear market for the category? Only time will tell, but history has shown that eventually the categories at the bottom of the return charts will rotate to the top. The question for investors is where it makes more sense to buy these categories. At the bottom when they are cheap, or at the top when they have momentum?

Looking into the future will always be an inexact science. It is hard enough to look into the present and understand what you see. We leave you with a final quote from another notable philosopher.

“Predictions are hard to make, especially about the future.”
Yogi Berra

The Fed Forecast

What will interest rates do? Who really knows? The answer to that question is important to the US economy, the equity markets and especially the fixed income markets. Many have a thoughtful hypothesis, but who can forecast the future?

In our KnowRisk(SM) Commentary from December 2012, The Warning Label, we stated that interest rates “according to the Federal Reserve, should remain low through 2015. After that, according to Warren Buffett, the billionaire chairman of Berkshire Hathaway Inc. it may be difficult for interest rates and inflation to remain low.” As we have seen so far, this is pretty close to the current consensus, but what about going forward?

The members and staff of the Federal Reserve Board Open Market Committee (FOMC) should have an idea, since they are the group who actually make the decision and set the short term federal funds rate. They nailed it in 2013 with a unanimous agreement of 25 basis points.

As you move out in time, the opinions start to vary but generally move up as noted in the graph above. The median of the group is still at 25 basis points for all of 2014, moving to 75 basis points for 2015, and out to 175 basis points for 2016 (although with a wide dispersion of opinions from 50 to 425 basis points). The “Longer Run” which goes out past 2016 is a fairly tight consensus of a 400 basis point Federal Funds rate.

To further look into the future, we looked into the futures. Futures contracts are the vehicle through which large sophisticated institutional investors are investing billions of dollars into future purchases of bonds out one, three, and five years into the future. The results seem to concur with the opinions of the Federal Reserve Board members.

Bond futures rate expectations

The Barclays Aggregate bond index is a common gage for the broad fixed income markets, like the S&P 500 is for stock. It is comprised of Treasury, mortgage, and corporate bonds. One of the reasons that the duration of the Barclays Aggregate index is longer than average today is the low level of yields and the higher allocation to US Treasury bonds. This silent change means higher risk and lower return for what has traditionally been considered a low risk asset.

There is a tradeoff between the two main risks of fixed income investing: duration risk and credit risk. Duration risk is the effect of interest rate changes on bond prices. Credit risk is the risk of default. In the current environment, the probability and magnitude of the duration risk is perceived as being much higher that the probability and magnitude of credit risk.

Duration is the calculation of the interest rate sensitivity of a bond, and it changes as interest rates change. Bond duration of 9 years, means that for every 1% rise of interest rates, that bond will decline in value by 9%. Mathematically, as yield goes up on a fixed-rate, fixed-maturity bond, duration goes down due to having higher coupon payments throughout the loan in proportion to the face value which is returned at maturity (and vice versa). Mortgage bond durations decline as yields decline but can really shoot up in rising rate environments (due to slower refinance speed). This makes duration risk a moving target. The following graph shows the effect on duration since 1985 for a 10 year US Treasury bond. As rates went down from 12% to 2%, duration went up from 5 years to 9 years.

As Yields Have Declined, Duration Has Extended

10-Year US Treasury Note Rate and Duration History

10-Year US Treasury Note rate and duration history

This makes it a tough environment for fixed income investments. If you take the same results indicated from the Fed forecast and the futures market, and assume a monthly change of US Treasury rates to the forward target rates, you get a result for the fixed income markets as shown on the next graph. These are seven of the major indexes from Barclays. All but one is flat to negative for the next three years, and the rest of the group returns only a 0.35% to 1.09% annualized performance for the next five years. This will be a disappointing result for investors looking for the traditional low volatility, high interest return from bonds. The short term high yield index is the only one which shows results similar to what bond investors have enjoyed for the last 30 years, but high yield (lower quality) bonds carry more credit risk for investors to take into account. The solution does not appear to be in most of these indexes and may lie outside of the traditional approach to bonds.

Projected fixed income index returns

This research shows that the indexes for traditional fixed income may have a stiff headwind from rising rates and a difficult time protecting capital and making money. If the Fed’s forecast is right, most of the fixed income indexes are dead in the water for the next 5 years! If there was a multiyear bear market coming in the stock market, equity managers would be jumping up and down. The bond firms generally appear flat footed. Since interest rates have been falling for 30 years, most of the current bond portfolio managers have no experience in this environment. Pimco just replaced their CEO and the Portfolio Manager for their unconstrained product. Bill Gross is taking over this product personally.

Fixed-Income Opportunities — Investing Beyond the Aggregate

Fixed income opportunities beyond the Barclays Aggregate

The Barclays Aggregate represents roughly 35% of the investable fixed-income universe. The remaining 65% includes below investment grade, floating rate, and non-US bonds. All of these assets are less correlated to US Treasuries and many of them have higher yields. Again, as we mentioned in the previous KnowRisk Report: “Managers with the ability to adapt to change, with the ability to manage portfolio risk factors such as yield, duration, allocation weighting, and credit quality, can find success in multiple environments.” Unfortunately few do.

The future, at least the next 4-5 years of the future, may be in actively managing bonds outside the basic traditional domestic aggregate through actively utilizing all the fixed income components and with global diversification. There are a few managers who have adopted an “unconstrained” fixed income policy for this purpose. These managers search for yield while reducing the duration risk in different ways. Some assume more credit risk, while others keep the portfolio quality investment grade. Some raise large amounts of cash, while others short Treasury Bonds. Floating rate bonds are not ideal in a falling rate environment, but may be helpful in a flat to rising rate scenario. Because of the nature of the floating coupon rate, these types of bonds may have a duration risk approaching zero.

Some of the managers we have researched in this investment style include: Alliance Bernstein Unconstrained Bond (AGLIX), MainStay Unconstrained Bond (MSDIX), Metropolitan West Unconstrained Bond (MWCIX), Pimco Unconstrained Bond (PFIUX), and Western Asset Total Return Unconstrained (WAARX). It is important to know, and to be comfortable with the techniques the managers’ employ to address the current fixed income environment, so talk to a professional investment management consultant before investing.

Deep Dive: Floating Rate Bank Loan Funds

Funds Overview

Equitas believes that investing in floating rate bank loan funds offers clients the ability to lower interest rate risk on their portfolios while increasing the income potential of invested assets.

Floating rate bank loans (“bank loans”), also called leveraged loans, are loans made by large commercial banks to corporate customers, most of which are below investment grade.

These high yielding loans are called floating rate because the interest rate is not fixed but readjusts every 40-60 days (on average) based on changes in LIBOR. As LIBOR moves up or down, the interest rate the borrower pays also fluctuates, significantly reducing duration risk tied to interest rate moves.

Bank loans are issued to a wide variety of companies in a broad array of industries, from consumer products, to technology, to health care. Example companies include Heinz, Goodyear Tire, Clear Channel Communications, and Caesars Entertainment.

According to Moody’s these loans have a historical default rate of less than 4% with an average recapture rate of around 80%. Floating rate bank loan characteristics:

  • Yield higher (4.5%-5%)
  • Credit quality lower
  • Recapture rate higher
  • Correlation lower to Treasuries

Yield and Duration

When comparing bank loans to other fixed income asset classes the floating rate characteristic gives these investments an extremely short duration of 0.24 which can help protect the value of fixed income holdings in a rising rate environment.

Additionally, the yields on these loans are higher (4.5%-5%) than investment grade debt because companies borrowing under these structures are typically rated BBB- to C in credit quality, with the bulk of the loan market in the BB to B range.

Senior Structure

Although floating rate loans are lower in credit quality than investment grade corporate debt this credit risk is mitigated by their Senior-Secured status at the top of the capital structure.

Because they are lower rated on the credit scale they provide yields similar to those of high yield bonds but are more secure with collateral backing up the loans.

Floating rate loan capital structure seniority

Default and Recapture

Compared to high yield bonds these collateralized loans have demonstrated a historically lower default rate.

Additionally, the historical recapture rate on defaults for floating rate loans has averaged around 80% over the last three default cycles and is much higher than unsecured debt.

Default and recapture rates for floating rate loans

Effect of Changing Rates

This hypothetical graph shows the potential effect of rising interest rates on both bank loans and the US Aggregate Bond index. A rise in interest rates of 200 bps (2%) would result in a -8.7% loss for the index and a -0.1% loss for floating rate investments.

Hypothetical effect of a 200 bps rate rise on bank loans vs. the Aggregate Bond index

Correlation

Among fixed income investments floating rate loans have the lowest correlation (-0.37) to Treasuries and have the most ability to provide diversification within the category.

Correlation of floating rate loans to Treasuries versus other fixed income

Portfolio Composition

Creating a blended portfolio of traditional bond investments and floating rate loans has the ability to reduce the standard deviation of a fixed income portfolio while enhancing its return characteristics at the same time. This is in addition to the potential benefit of reducing the average duration for the whole portfolio and limiting the effect of rising interest rates.

Blended fixed income portfolio risk/return with floating rate loans

Back in the USA

As a proud member of the Baby Boomer generation, I can remember the surprise when the large bulge of population arrived at grade school, and there was no capacity in the school system. Portable buildings were erected to house the surplus students and a scramble for teachers ensued. When I got to junior high (now called middle school) there was the same surprise. High school yielded the same surprise. This is odd to think that a trend so slow would be a surprise. After all the population movement was only one year per year. Years later the lack of student population from the Baby Bust caused the closing of schools which came as another unforeseen surprise to the school system.

We are witnessing a similar phenomenon as the Emerging Markets of the world, led by China, develop, grow, and emerge. Running on a parallel track with the industrialized nations, China is going through the industrial revolution, the technological revolution, and the internet revolution simultaneously. As experienced by the developed countries of the West, the population ratio of 20% city dwellers to 80% farmers will be reversed. This is a population shift that will dwarf the Baby Boom. 80% of the Chinese population is over a billion people, more than three times the entire US population.

The new factory workers in the cities will become a growing middle class and will start to consume. What we are seeing in China is an economy that is switching gears. It is transitioning away from production and export, toward a consumption driven economy. The new administration in China wants this change to occur over time. Domestic consumption as a percent of GDP is significantly lower in China than developed economies, but is on the rise. We believe this transition will result in GDP growth coming in well below recent historic rates.

For domestic consumption as a percentage of GDP to increase significantly, it needs to grow much faster than overall GDP, which in turn means that the fixed asset investment portion of the economy needs to grow much slower. We expect this transition to make China a challenging environment for growth for some time. While we do not expect all of China to be problematic, we believe that future growth will be reliant on the emerging Chinese consumer, and not as much on resource consumption.

From a macroeconomic perspective, we believe global GDP growth for all the Emerging Markets will be slower for the foreseeable future and that China is a primary example. In China, GDP growth has been declining since 2007. From 2000 to 2007, the growth rate was 9.4% — the largest growth rate by far for a major nation. The peak was during 2006-07 when GDP grew at 11.3%.

Even though the emerging markets are growing at much faster rates than developed markets, we don’t think that is going to translate into stock performance from here and the domestic companies doing business in the Emerging Markets will have an advantage.

The difference between emerging market and developed market economic growth is quite stark. Unfortunately in the developed world economic growth is much slower than the emerging world. The US is in a slow 1%-2% growth environment at best. Much of Europe is in recession with some members even in depression, and Japan is mired in a decade-long stagnation. All three are attempting to manufacture growth via loose monetary policy. But in terms of aggregate growth, the developed world is not going to grow its way out either. While Quantitative Easing (QE) has been effective in re-inflating asset prices, we believe it will prove to have a continued, although diminishing, impact on economic growth. What the developed countries need is a growing source of new consumers.

70% of the US economy is driven by the consumer. At the highest end, the developed market consumer is doing quite well, while the average consumer is struggling with elevated unemployment and wages which are stagnant at best. The emerging market consumer is less well understood, but is a rapidly growing population boom.

In an interconnected global economy, the emerging consumer has more disposable income than ever before, and as a result, we believe they will demand increasing amounts of higher-quality goods and services. To that end, we believe the real beneficiaries of the rising emerging market consumer will be the Western companies that provide these goods and services.

So how do investors make money from this new consumer growth? From a fundamental point of view, US equities appear far more attractive than emerging market equities. 40% of the earnings of the companies in the S&P 500 now come from offshore. For example, these 6 American based companies are all heavily involved in global and emerging markets.

Exxon-Mobile (XOM) — 81% of Exxon-Mobile’s total sales are from foreign markets.

General Electric (GE) — Over half (52%) of General Electric’s total sales are from foreign markets.

Coca-Cola (KO) — Coke derives 54.9% of its total revenue from overseas markets.

IBM (IBM) — IBM derives 56% of its total revenue from outside the Americas.

Caterpillar Inc. (CAT) — CAT generates 63% of its total revenue from outside North America.

Pfizer (PFE) — In the drug market, the compound annual growth rate (CAGR) for aggregate sales in emerging markets is expected to be 12%-15% for the 2012-2016 period. Over this same period, the global drug market’s dollar value is expected to have a CAGR of 3%-6%. (Information was obtained from the S&P Stock Report. Revenue and sales data are from 2012.)

We believe US companies are better positioned to capture the consumer expansion in a low growth world for the following reasons:

  • US and other developed market companies generally possess higher value-added human capital and technology leadership. It will take a long time for emerging market companies to compete.
  • Developed market companies generally have higher-quality management. Many emerging market companies are either controlled by governments or families and are not necessarily professionally managed. Particularly since the 2008 crisis, US companies have been better allocators of capital, far more shareholder oriented, and more focused on rates of return and returning capital through dividends and stock buybacks.
  • US and developed market companies are generally larger and more liquid. In a market that values safety and return of principal, that’s an important factor. From a relative perspective, not only do they have higher-quality businesses, they have cheaper access to capital, healthier balance sheets, and less exposure to any single regional economy.
  • Lastly, we believe that leading US and Western companies are better positioned to capture growth which is not reliant on overall GDP growth. Growth from technology, innovation, and other unique pockets of growth is better reaped by more highly skilled management teams providing higher-quality, more sophisticated goods and services which are more likely delivered by Western companies.
  • Emerging market companies, on the other hand, tend to benefit primarily from GDP growth. As evidence of this, we compared earnings per share for the S&P, which has been rising since 2009, with earnings per share of the Emerging Markets Index, which has actually been declining since the middle of 2010, despite revenues continuing to increase.

This emerging market consumer boom may not come at as predictable a pace as the one year per year US baby boom, but it is coming. It should be a big benefit to the consumer oriented economies of the developed countries of the West. One factor that could slow down this trend would be another global recession. However, even the Great Recession of 2008 only delayed the development, and did not derail this trend.

The Working Retired

One day retirement wealth will be important — at least to those of us still kicking. The sources that determine our success include Social Security, IRAs, pensions, inheritance, personal savings, retirement savings plans like 401(k) and now, unfortunately, working in retirement. In this KnowRisk commentary we look at the current state of workers preparing for retirement and ‘best practices’ that businesses can implement to establish effective retirement platforms that offer owners and their employees the best chance for retirement success. Unfortunately, most small businesses are expert in their fields, but lack the resources and staff to deliver prudent expertise for the many types of retirement plans like 401(k), 403(b), profit sharing, pension, and cash balance. The pension consultants at Equitas are assisting businesses by providing the needed fiduciary expertise in an effort intended to deliver excellence in retirement design and services.

Retirement Uncertainty

The path to retirement is in transition. The U.S. labor force is moving from a dependence on company provided retirement income, to self-reliance. The trend is from Social Security, to self-security. As recently as 1998, 90 percent of Fortune 100 companies offered defined benefit plans, according to a study by consulting firm Towers Watson & Company. As of June 2012, that number had declined to 30 percent. These numbers are significantly smaller for the majority of workers employed by small businesses. In contrast, the number of Fortune 100 companies that offered only a 401(k) plan has grown from 10 percent in 1998 to 70 percent today. The implications are important for the U.S. labor force. Today’s responsibility for retirement falls squarely on the shoulders of the individual with minimal assistance from the corporate employer, often offering only a match or profit sharing contribution.

This transition has made the current state of retirement quite uncertain. According to a recent report released by the Employee Benefit Research Institute, 57% of U.S. workers surveyed have less than $25,000 in total household savings, and a record 49% are not too confident or have no confidence that they will be able to comfortably retire.

Worker confidence in retirement readiness

Another report released by Financial Finesse shows only 39% of those surveyed have even determined a retirement goal. In general, employees are ill informed and ill prepared to succeed in retirement.

This has led to a trend to continue to work beyond retirement. According to the 2013 EBRI Retirement Confidence Survey, 22% have extended their expected retirement age with 75% expecting employment to play a major (21%) or minor (54%) role in their retirement income.

Expected role of employment income in retirement

How can businesses and organizations help reverse this trend? In yesterday’s world, offering a retirement plan may have sufficed. In today’s world it is not enough. The defined contribution plan has elevated in importance and the responsibilities to assist workers in building a retirement nest-egg have never been greater. What are the duties for corporate America in the new world of retirement and how can they best help their employees? In this edition of ‘KnowRisk’ we first look at some of the legal responsibilities as defined by the Employee Retirement Income Securities Act (ERISA) as well as several practices that we believe will add to the success of building retirement wealth for our workers.

Duties

In general, companies that offer a 401(k) must serve as fiduciaries to their plan. This means, once they determine the initial structure of their plan, they must put the interest of their participants first. ERISA imposes a heightened standard of prudence known as the ‘Prudent Expert’ rule. The rule states that plan fiduciaries must make decisions “with the care, skill, prudence, and diligence under the circumstances then prevailing that a prudent man acting in a like capacity and familiar with such matters would use in the conduct of an enterprise of a like character and with like aims.”

The key phrase is ‘and familiar with such matters’ meaning fiduciaries should act as an ‘expert’ would in making plan decisions. For large companies with human resource departments, this task is manageable. For smaller businesses and professional organizations, this responsibility is much more difficult. Small businesses often lack the resources and staff to deliver prudent expertise for retirement plans. In this case plan sponsors should bring in specialists to assist the plan in making decisions. In fact in Katsaros v. Cody, 744 F.2d 279 (2d Cir.), (1984) it was found that “Where a trustee does not possess the education, experience and skill required to make a decision concerning the investment of a plan’s assets, he has an affirmative duty to seek independent counsel in making the decision.”

Outside Fiduciaries — ERISA Section 3(21) and 3(38)

There are two types of investment experts a plan sponsor may bring in to help them manage their fiduciary duties. Under ERISA they are defined as Section 3(21) and Section 3(38) fiduciaries.

Any individual can be a fiduciary under Section 3(21) if he or she exercises any authority or control over the management of the plan or the management or disposition of its assets; if he or she renders investment advice for a fee (or has any authority or responsibility to do so); if he or she has any discretionary responsibility in the administration of the plan, or is named in the plan documents.

A Section 3(38) fiduciary is an “investment manager” and by definition is a fiduciary because they take discretion, authority, and control of the plan’s assets. ERISA provides that a plan sponsor can delegate the significant responsibility (and significant liability) of selecting, monitoring and replacing of investments to the 3(38) investment manager fiduciary.

A 3(21) investment manager could be thought of as someone in the rear seat of a vehicle providing directions to the driver (plan sponsor) whereas a 3(38) would actually take the wheel and the responsibility for getting the passengers (participants) to their destination.

Let’s apply that definition to advisors. An individual who simply makes recommendations under suitability requirements to and for the plan for which it has no discretionary authority or responsibility is not a “fiduciary” and therefore has no legal liability under ERISA as a fiduciary. In that case, even when the plan sponsor adopts the advisor’s recommendations, the plan sponsor retains all of the fiduciary responsibility and liability of the decisions. If the advisor is only giving recommendations and the plan sponsor has the discretion to take or disregard the advice, then the advisor is probably not acting as a fiduciary and offers no practical protection from liability for the plan sponsor. That is significantly different than a 3(38) investment advisor who is presumed by definition to have actual discretion and control over the plan’s assets and management.

The advantage of a properly named 3(38) is that once the plan sponsor effectively hands over authority to the 3(38) fiduciary to make investment decisions, the 3(38) fiduciary assumes legal responsibility and liability for the decisions it makes, which enables the plan sponsor to better manage and mitigate their fiduciary risk.

However, a point that is often overlooked is that the plan sponsor cannot completely eliminate its fiduciary liability. The plan sponsor is still responsible for the prudent selection of the 3(38) advisor and must monitor and benchmark that 3(38) advisor. Also, if the plan sponsor overrides the decisions of the 3(38) advisor, the plan sponsor assumes the responsibility and liability.

One more point to be made regarding some advisors. In today’s world many advisors are not acting per the fiduciary standard, which would require that the advisor:

  • Act solely in the best interest of the plan sponsor, participants, and beneficiaries of the plan
  • Avoid conflicts of interest or fairly manage them in the client’s favor
  • Disclose all forms of compensation, both direct and indirect

Employer Best Practices

Participant Education

As indicated in the statistics mentioned earlier in this report, the vast majority of employees are neither saving enough, nor have they even determined how much they need to save to be ready for retirement. While it is unrealistic to turn participants into investment and retirement experts, it is prudent to educate and inform them. Fiduciaries should provide information needed by employees to identify retirement solutions. Participants must know their future is as important as any current creditors and they are responsible for setting aside a portion of their income today to provide for their retirement. They should be offered solutions as to how much to save either through retirement calculators or encouraged to save at a reasonable rate, i.e. 10%. They should understand the tax benefits associated with pre-tax savings and the power of tax deferred growth.

Plan sponsors have the fiduciary duty to make sure participants are given adequate information to make informed decisions and they have the tools to track their progress and determine their savings’ effectiveness. This can be accomplished through tools such as ‘gap analysis’ which measures current savings against projected needs to determine if there is a ‘gap’ in the savings pattern or if a participant is saving at an adequate pace. In general, when employees become more confident in their decision making ability, they become more active plan participants.

Plan Investments

Plan investments represent the tools of the retirement process and ideally, the better the tools the better the end result. Even minimum performance improvements can have significant long-term benefits when compounded over several years. This is one of the most difficult of fiduciary duties because most plan sponsors are not investment experts, and many plan providers require the use of certain investment vehicles that may or may not be in the best interest of the participants. Often these same providers contractually require the plan sponsor to assume the fiduciary responsibility for the selection of the funds the provider requires the plan to use. This can create conflicts-of-interest between the employer and the provider.

Best practices suggest that investment selection be completely free of conflicts. While most plan sponsors may not possess the ‘prudent expert’ skills to select plan investments, these fiduciary duties can be assigned to third parties that will serve as 3(38) fiduciaries for the plan and make independent and conflict-free investment selections. Then the fiduciary duty of the plan sponsor is to assure that care was exercised in the appointment of the investment fiduciary.

In addition to the selection of individual funds, there is an important growing trend to offer professionally managed portfolios and other ‘portfolio’ investments such as target date funds. Most fiduciaries realize that participants cannot become investment experts in an hour enrollment meeting. Providing professional investment solutions can enhance a participant’s chances of retirement success.

Plan Expenses

Fiduciaries are required to understand plan charges, but prior to 2012 plan providers were not required to disclose fees. Without this requirement, it was difficult for plan sponsors to understand the expenses they were paying since many providers used investment products that made fee disclosure extremely difficult. In 2012 the Department of Labor (DOL) finally established fee disclosure rules for the retirement industry. Although interpretation of the rules is somewhat broad, today plan fiduciaries have better tools to determine the expenses they are paying.

Retirement plans require eight special services including plan design, recordkeeping, administration, regulatory testing, 5500 filings, asset custody, participant education, and investment advisory services. Expenses should be reasonable and based on services rendered. As in most professional services, ‘cheap’ is not necessarily best, but excessive fees can hinder performance. Most 401(k) plans use mutual funds or exchange traded funds and internal expenses should be a consideration. However, the investment world is filled with higher cost, better performing funds so expenses are only one of the factors in determining the best investment selection for a plan. Using a 3(38) investment fiduciary to select the investments for a plan is a solid choice for plan sponsors unfamiliar with the intricacies of the investment world.

Benchmarking Plan Effectiveness

Measuring a plan’s effectiveness and communicating that information to employees demonstrates a sincere interest in a participant’s retirement future. Topics for review should include participation levels and savings rates as well as fund performance, asset classes and expenses. Having a plan is the first step. Making sure the plan is achieving desired results is the goal in delivering enhanced fiduciary accountability and improving long-term retirement success for employees.

Conclusion

Corporate retirement is in transition. Plans are changing from employer driven defined benefit plans, to employee driven defined contribution plans. The trend is from Social Security, to self-security. Employers are facing a learning curve as well and, especially for the small business, it is a difficult challenge to satisfy the fiduciary duties imposed by ERISA and provide a solid retirement solution for employees. Help is available for many companies through a new breed of 3(38) investment fiduciary that can remove some of the burdens and provide ERISA level fiduciary services for small and large business. Talk to the consultants at Equitas for professional assistance in the development and support of delivering quality, conflict-free, retirement solutions.

The Warning Label

Investment General’s Warning
Bonds may come with significant risk of rising rates, loss of purchasing power, and inflation.

It is no secret that the Federal Funds rate is extremely low. It has been low for a while, and according to the Federal Reserve, should remain low through 2015. After that, according to Warren Buffett, the billionaire chairman of Berkshire Hathaway Inc., it may be difficult for interest rates and inflation to remain low.

Buffett believes low interest rates and inflation should dissuade investors from buying bonds and other holdings tied to currencies. “They are among the most dangerous of assets,” Buffett said in a recent adaptation of his annual letter to shareholders. “Over the past century these instruments have destroyed the purchasing power of investors in many countries, even as these holders continued to receive timely payments of interest and principal.”

“High interest rates, of course, can compensate purchasers for the inflation risk they face with currency-based investments — and indeed, rates in the early 1980s did that job nicely,” Buffett wrote. “Current rates, however, do not come close to offsetting the purchasing-power risk that investors assume. Right now bonds should come with a warning label.”

While many investors clearly understand that low rates will not last forever, it becomes more difficult to determine exactly how this will affect any given portfolio. The common understanding is that as rates rise, bond prices will fall. This is a fundamental characteristic of bonds which is calculated and quantified by the duration of the bond.

In order to stay ahead of the trends, we have examined this scenario from several angles, with emphasis on how we expect our current managers to navigate the change. The following is a graph of the Fed Funds Rate and the 10 Year Treasury Rate over the past few decades. We identified four periods, highlighted in yellow, which experienced clear rate increases.

To isolate our managers’ performance tendencies during rising rates, we graphed the total return of some of our managers, and three fixed income indexes, in each of those periods shown in the following chart.

Manager total return during periods of rising rates

In these four periods of rising rates, we were pleasantly reassured that our managers had the acumen to navigate troubled waters. This was accomplished by various techniques of managing bond types, sector allocation, duration, maturity, credit quality, country, and currency. Out of 7 managers over 4 separate periods, only one manager in only one time period experienced a small loss. That manager is a global fixed income manager who may have had other issues affecting performance other than US interest rates. On a similar note, one of our emerging market debt managers added diversification and was able to return over 40% during one of the rising rate periods.

Upside/downside capture ratios of Equitas fixed income managers

Next, we examined how a few of our Fixed Income managers performed across all markets in the past five years. The upside/downside capture chart above is a graphical representation of this. We were pleased to confirm that these managers have ALL captured at least 25% more upside than downside against the Bank of America 7-10 Year Treasuries index, and are head and shoulders above the 10+ year index. In fact, many of our managers have consistently protected capital and even made money in these down markets.

While the upside/downside chart paints a detailed picture of how our managers have historically performed during periods of rising rates, we also wanted to isolate down market performance. The result is displayed visually in the “Down Market Annual Return” graph below. Again, we notice that the majority of our managers have positive performance during difficult periods.

Down market annual return by manager

After examining periods of recent interest rises from multiple angles, the Equitas selection of managers not only performed well during periods of rising rates, but has also managed to protect capital during down markets as a whole. We take pride in our ability to select manager talent to manage our clients’ assets.

Rates are just one of several factors that can be managed. Managers with the ability to adapt to change, with the ability to manage portfolio risk factors such as yield, duration, allocation weighting, and credit quality, can find success in multiple environments. If we go back to an environment like the 1970s, it may be difficult for any manager to navigate those extremes, but these managers have done well with the recent changes.

While we have evidence of our managers’ ability to navigate a rising rate environment, they might not, however, have to use that preparation anytime soon. Ben Bernanke, chief of the Federal Reserve, has given indication that rates might not rise until 2015. Bernanke says the Fed needs to drive down borrowing rates because the economy is not growing fast enough to reduce high unemployment, currently around 8%, to 6.5%. This is known as the ‘Evans Rule’ put forth by Chicago Fed President Charlie Evans, who has long maintained that the Fed should promise not to tighten monetary policy until the economy hits specific economic thresholds. In other words, rather than the Fed promising to keep rates low until 2015 (or some other arbitrary date) the promise is now to keep rates low until we’ve hit either 6.5 percent unemployment or 2.5 percent inflation.

Projected timeline to full employment

As we approach 2015, the Fed will no doubt offer more guidance. The chart above offers some tentative guidance on when we will reach an acceptable level of unemployment based on how many jobs the economy adds every month. Whether the economy returns to full capacity and interest rates rise to their historical averages, or we muddle through in a low growth scenario like Japan has done for over a decade, we believe our selection of managers has the skill to be able to navigate the markets.

An Interest in Dividends

The Case for Dividends

“Do you know the only thing that gives me pleasure? It is to see my dividends coming in.”
John D. Rockefeller

While no human has ever accumulated the wealth Rockefeller had by the early 20th Century, his notion on the importance of dividends is applicable to even the most novice investor today. Income and cash flow remain critical to investors meeting their objectives, and in the current low-interest rate environment, investors are once again turning to dividends to assist them in reaching their goals.

The idea of shareholders receiving a cash distribution for their investment was one of the earliest innovations of financial markets. Dividends first appeared in 1602 with the Dutch East India Company (DEIC). The DEIC used a corporate charter to pool several projects rather than just one in order to avoid the risk of a single project tanking the whole company. After every project’s successful completion, the company returned cash to stakeholders in the form of dividends. This advancement was so successful that it helped enable the company to become the world’s largest for over 200 years, and eventually led to the creation of the world’s first stock market.

In modern times, dividends have been a staple among 401(k) and retirement plans, high net worth individuals, foundations and endowments. They provide the stability of periodic income, along with the ability to capture some gains from the stock market. In this time of prolonged rock-bottom interest rates, dividend paying stocks are as important as ever.

A well-known tenant of today’s investment professional world is that dividends can help drive the value of a stock. While a common perception is that about half of a stock’s total return depends on dividend payments, the studies make for a more compelling case. According to a study by Federated Investors using data from Yale professor Robert Shiller, over 90% of a stock’s total return directly depends on the dividend yield and dividend growth.

As we wrote in our KnowRisk commentary for the 1st Quarter 2012, the record low yields from fixed income “present investors with an asymmetric risk/return profile; that is, investors face a potentially large downside to their investment with only a modest upside.” We termed it “Return-Free Risk.” Interest rates do not have much room to go lower, but rising rates could have devastating effects on an undiversified fixed income portfolio. Dividend paying stocks help provide investors with income, while mitigating the interest rate risk that accompanies many fixed income investments, and provide the potential for growth.

Demand for fixed income instruments has driven interest rates so low that several companies now pay higher dividends on their stock than they pay interest on their bonds. AT&T serves as an example. AT&T’s dividend yield at the end of 3rd Quarter 2012 was 4.67% while their 10 year bond with a coupon has a yield to maturity of only 2.29%. Assuming that you receive the face value of the bond back at maturity, AT&T makes all its interest payments and the company does not cut its dividend, AT&T’s stock would have to decline 23.1% in order for the bond to have a higher net payoff at maturity.

AT&T dividend yield vs. bond yield to maturity

Source: Equitas Capital with data from Bloomberg Professional

This same exercise can be repeated with several diversified dividend paying stocks like Intel, GE, Pfizer and others that offer a greater dividend yield than bond yield to maturity.

Rolling 10-year price returns of the Dow Jones Industrial Average

Source: Equitas Capital with data from the Federal Reserve and Dow Jones

In order to give some context to these figures, we graphed a chart of rolling 10-year price returns of the Dow Jones Industrial Average back to the 1930s. As you can see, there have been only two instances since the Great Depression where the blue chip stocks have experienced price losses greater than -23.1% over a 10-year period. The drawdowns did not go much beyond the -23.1% mark. Given the historically low yields in the fixed income market, investors utilizing dividend-paying equity investments may help generate more attractive returns given the depth of correction that would have to occur for bonds to outperform.

Sample companies with higher dividend yield than corporate bond yield to maturity

Source: Miller Howard Investments

The list above shows a diversified list of 32 companies from one of our money managers where the dividend rates are higher than their bond interest. Over the past year or so, the corporations on this list raised the dividend an average of 10.8% (excluding an outlier which would make it 21%). Dividend growth, as we noted earlier, remains a large driver of returns. Other money managers and indices have also focused on dividend growth. Standard and Poor’s, for instance, has an index called the S&P 500 Dividend Aristocrats which are large-cap US companies that have raised their corporate dividend every year for 25 years.

The (Very) Long-Term Picture

US Treasury yield vs. S&P 500 dividend yield since the 1870s

Source: The Big Picture (ritholtz.com), and Global Financial Data

How does the current level of stock dividend yield compare historically? The above chart from Global Financial Data offers a bit of insight. It compares the historical yield on a US 10-year Treasury Bond to the yield on the S&P 500, which is estimated before the creation of the index (note: US Treasuries are theoretically termed “risk-free” while corporate bonds have credit risk among other detractors that would make them riskier; not all stocks in the S&P 500 pay dividends). Until the mid-1950s, stocks virtually always had higher dividends than US Bonds. Presumably this was to incentivize investors into the more volatile asset class. As capital markets developed in the later part of the 20th Century, however, bond yields consistently outpaced stock dividends. Except for a brief period in 2008, this phenomenon held true until recently. In other words, for one of the only times in more than 50 years, dividends are offering higher yields than government bonds.

The Fiscal Cliff — Will the Election Change Anything?

A topic of interest for all market participants involves the so-called “fiscal cliff,” referring to the expiration of tax cuts and automatic reductions in federal government spending at the end of 2012 that could threaten an already weak domestic economy. For dividend investors, the special 15% taxation treatment of dividends is set to expire at the end of this year. Any analysis of whether this special rate will be renewed must be done in the context of the debate on the National Debt. In 2011, the US Government’s deficit rose dangerously close to an artificially imposed “debt ceiling.”

With political parties in a deadlock, Congress managed to pass a short term measure to kick the can down the road to December 31, 2012. This partisan deadlock greatly contributed to Standard and Poor’s decision to lower the US sovereign credit rating from the gilded AAA, and other credit rating agencies have repeatedly noted that the lack of a resolution from Washington threatens further downgrades. At midnight on December 31 this year, several changes in taxation policy are set to expire as a result of short term policy extensions in 2011. What effect will this have on dividends?

Historical tax effects on dividend-paying stock returns

Source: Schafer Cullen Capital Management, data from Ned Davis, Tax Foundation.org, and S&P

The special tax benefit to dividends implemented by President Bush in 2003, and extended by President Obama in 2010, is also set to expire at the end of the year. While this has the potential to affect the attractiveness of a dividend-based investment strategy, research on the subject paints a different picture. Take for example, an analysis by Schaefer Cullen, Ned Davis and Tax Foundation.org which examined US equity returns for both dividend and non-dividend paying companies over various time periods at different tax rates. Historically, dividend paying stocks have outperformed (sometimes by a considerable margin) their non-dividend paying counterparts in almost every period since 1972.

Given the uncertainty in Washington with the potential “fiscal cliff” and possible raising of taxes on dividend investors, it is important to consider performance of the stocks through various tax regimes. Dividend stocks have offered more attractive returns through numerous environments and have also produced cash flow during that time regardless of tax rates.

Gridlock in Washington

Next month, Americans will head to the voting booth to register their choice for President of the United States as well as new Congress. While the campaign season seems to be never-ending in recent years and voters once again are faced with “the most important election” in their lifetimes, many investors are more curious as to how elections and results may drive markets. Equitas is staying out of the political game and will leave the choice to the American populace, but an examination of the historical impact of elections on equity markets may prove beneficial. As such, it may help planning purposes if the results could be estimated in advance. Although there is no shortage of polls trying to guess the results of the upcoming election, many regard “prediction markets” (where participants can bet on the outcome of events like elections) as a way to “follow the money” on who is likely to be elected. Even after a universally regarded lackluster performance in the first debate, as of October 9, 2012 InTrade, one of these “prediction markets,” gives Barack Obama nearly a 63% chance of reelection (albeit after a big decline following the debate).

Prediction market odds for the 2012 Presidential election

While the Presidential race tightens, it is also important to look at the impact in Congress. The opposite side of the aisle might find comfort in the prediction market’s odds of Republicans controlling at least half of the legislature. As of October 9th 2012, InTrade put the odds over 88% of Republicans maintaining control of the House.

Prediction market odds for Republican control of Congress

Regardless of one’s own political affiliation and beliefs, it may be a more fruitful exercise to put these numbers in historical context. The chart below from JP Morgan Asset Management shows historical returns for different combinations of governing parties from 1937-2011. In their findings, the most positive returns for the domestic equity markets occurred with a Republican President and Republican Congress (17.4%). The second best time for market investors, however, occurred with a Democratic President and split Congress, returning 15.4% per annum. Needless to say, the stock market is subject to greater factors than simple party designations, but it certainly is interesting to keep the historical returns in mind as the election approaches.

Historical annual market returns by governing party combination

Source: JP Morgan Asset Management; data compiled by Professors Keith T. Poole and Howard Rosenthal, available at www.voteview.com. Stock market returns are total return and calculated by calendar year.

As the elections and “fiscal cliff” draw closer (accompanied by continued market volatility) it remains important for investors to be diligent in order to meet their long-term objectives. Diversification across asset classes and geographies continues to be a good method for producing positive risk-adjusted returns through turbulent markets. The dividend story extends beyond the United States as well.

International dividend yields by region

With interest rates at current levels for fixed income assets, attractive opportunities may also be found in dividend-paying equity investments around the world. In some cases, equity investments are yielding considerably more than their fixed income counterparts. While dividend paying stocks are, of course, subject to market declines, they also may appreciate in value and raise dividend rates. Conversely, with yields at current low levels, many fixed income investments are subject to duration (interest rate) risk which could lead to falls in the market value of the securities. Again, with the uncertainty in the financial markets, dividend paying stocks may offer a solution to increase income and mitigate some of the interest rate risk and volatility in investors’ portfolios.

So now after a fifty year hiatus, stock dividends have returned to their historical position and are again yielding higher interest than government bonds. With the potential for corporations to raise dividends over time, the opportunity is even more compelling. As you know, after issuance, bond coupon rates do not get raised, and if anything, get refinanced to the lowest rate possible.

Many types of investors need cash flow: foundations, endowments, insurance companies, and retirees. It is nice to have another asset class, besides traditional bonds, to help diversify risk and deliver needed cash flow to portfolios. As you have read from our previous KnowRisk Commentaries, there are basically two risks for government bonds at this point. One is that interest rates go up, and the other is that they don’t.

It’s a (Not So) Small World, After All

The iconic Sherman brothers’ song written for Walt Disney for the 1964 World’s Fair originally served to invoke world unity after the Cuban Missile Crisis. Capital markets have also helped to unite the world, but as we will see “small” may not be the adjective to describe them.

While markets have been an integral part of human society since man left the fields for the city, capital markets took longer to develop. It was not until the early 17th century, when the Dutch East India Company offered shares of its company, that the modern equity markets were born. In the four centuries that have passed, capital markets, both equity and debt markets, have become integral to commerce, industry, politics, and broad society. Without the flow of capital from those who have it to those who need it, it is safe to say technological innovation would have stagnated and global trade would remain in infantile stages. Yet, one only needs to examine their sheer enormity in order to grasp the fundamental importance of capital markets.

The most recognizable market to the average person is, of course, the stock market. Every evening the news recites the equity market performance for the day, and that does not even account for the 24/7 coverage on Bloomberg or CNBC about the next big trade or latest earnings report. But just how big are the total equity markets in the United States and, more importantly, the world?

The Stock Market

The answer, not surprisingly, is immense. According to Bloomberg, on July 9, 2012, the total market capitalization of the United States equity markets was 105.8% of the Gross Domestic Product (GDP), or a bit more than $16 trillion. The world equity markets as a whole had a total market capitalization of $47.6 trillion at the same time, making the United States home to approximately a third of all stocks. More telling, however, is the trend in the size of the US stock market compared to the rest of the world. Over the last decade or so, the US market has fallen from about 45% of global markets to its current 33% level.

Source: Bloomberg Professional

Even more illuminating, according to a 2010 study by Russell Investments, “Globalization, equity markets evolution and the perils of home-country bias,” in 1985 the US comprised 66% of global market capitalization. Many reasons can be offered as an explanation for this, but the change is NOT because of a decrease in the value of US based investment markets. On the contrary the US market is much higher today than years ago. The reason is the growth rate of the international markets has been at a much higher rate than the US. The most apparent result involves a decreased role of the US as the world’s sole economic power. In fact, the economies of the entire world’s developed markets have fallen as a share of total market capitalization, and continue to fall, in comparison to the emerging markets (once known as the “third world”).

Emerging vs. developed market share of global metrics

Source: The Economist

It is also interesting to compare the growth of emerging economies and the relative market capitalization of those economies. Emerging markets have captivated investors in recent years and with good reason. As the chart from The Economist highlights, emerging economies have become world leaders in several important categories. For instance, they have well over three quarters of the world population and foreign exchange reserves. Additionally, in terms of purchasing-power parity, emerging economies now comprise more than half of global production. At the same time, the emerging countries make up less than a quarter of public-sector debt.

With so many positives driving emerging growth, one area they have lagged behind involves the development of equity markets. According to The Economist, in 2010 broad emerging equity market capitalization was responsible for about just a third of the total global market. When focusing on the four most prevalent emerging economies, the issue becomes more pronounced. Bloomberg’s most recent data shows that total market capitalization of the BRIC countries (Brazil, Russia, India and China) made up just 12.2% of the world. In terms of dollars, those four countries’ total combined market capitalization is approximately $5.8 trillion, a mere 36% of the United States. While emerging economies will continue to have a growing impact on the world economy, it is reasonable to expect their share of global equity market capitalization to increase as well.

The Debt Markets

While equity markets serve as the most recognizable capital market, they do not make up the largest position. In fact, debt markets are about twice the size of the world’s stock markets. According to the Bank of International Settlements (BIS), at the end of 2010, total global debt markets had nearly $95 trillion outstanding. It comes as no surprise, therefore, that many institutions and politicians focus on the bond market as a determinant of future economic growth. As Louisiana native James Carville appropriately noted during his time with the Clinton Administration, “I used to think that if there was reincarnation, I wanted to come back as the president or the pope or as a .400 baseball hitter. But now I would like to come back as the bond market. You can intimidate everybody.” Clearly, the bond market’s enormous size shapes not only investor sentiment, but also national policy.

Global debt markets outstanding

Source: Econideal.com, BIS

One other interesting note about the debt markets involves the geographic distribution. Similar to the equity markets, US total debt equals roughly one third of total debt outstanding (about $32.5 trillion). Additionally, the Japanese total debt market comprises another 15% of the world markets. A major difference between stocks and debt involves the concentration of debt securities. While the US has roughly the same percentage, Japan has a much larger concentration than within equity markets (15% vs. 7%).

Geographic distribution of global debt markets

Source: Econideal.com, BIS

Perhaps the largest insight one can gain from the bond market involves the size of debt relative to the size of the economy. To reiterate a point made earlier, many emerging economies have much lower total debt levels than some of their more developed counterparts. For instance, China and Brazil have total debts that are 53% and 72% the size of their economies, respectively. On the other hand, many developed countries have total debt that has exploded well beyond the size of their economies, including the United States and the U.K., which each have Debt/GDP ratios above 200%. While many traditional developed economies will be hindered by high debt service, not only by the government but the consumer and business sectors as well, emerging economies will have more flexibility in capital decision making to continue strong growth. The debt markets play an essential role in determining global growth. At twice the size of equity markets they can, as Carville put it, “intimidate everybody.” Yet, there is one more market that deserves mention which dwarfs both credit and equity markets.

The Other Market

The market for derivatives, that is, a financial instrument whose value is derived from the price or level of something else, far surpasses any other capital market. Derivatives come in many varieties. Some derivatives, like stock options or futures contracts on commodities, are cleared through a central exchange with standardized contracts regulated by the government. Others, however, such as swaps on interest rates, credit default swaps, foreign exchange derivatives, and other forward contracts can be highly customized, complex, and only started to gain regulatory attention after the financial crisis in 2008. These so called over-the-counter (OTC) derivatives have grown immensely in recent years as many financial and non-financial institutions use them to hedge all sorts of risk. At the end of 2011, the BIS estimated the notional amount of OTC derivatives to be a whopping $647 trillion. Considering the Gross World Product (or world GDP) for 2011 was about $70 trillion nominal, the amount of over-the-counter derivatives was more than 900% as much as global output. Granted, most of these contracts were used to hedge other positions and the net amount of derivatives was much smaller than the notional amount, but nonetheless the number is staggering.

Notional value of OTC derivatives versus world GDP

The overwhelming size of the OTC derivatives market does highlight the interconnectedness of modern financial markets. It also illustrates why certain institutions (Bank of America, American International Group (AIG) and Citigroup come to mind) may be considered “too big to fail” as a bankruptcy could cause a domino effect in the world economy. While many investors look to the stock and bond markets, the size and stability of the derivatives markets may be more critical to the long term health of the global economy.

At a certain point, of course, the numbers become so astronomical that they begin to lose meaning and effect. After all, a difference between $47 trillion and $48 trillion does not seem that large. For a bit of perspective on how large a number a trillion is, consider human history. A trillion seconds is equal to roughly 31,700 years. Agricultural societies emerged merely 12,000 years ago, or a few hundred billion seconds ago. In other words, a trillion is a number that is more appropriate for measuring the distance to stars rather than human society.

Home Country Bias

A key takeaway from the exercise of measuring financial markets, other than an attempt to grasp their enormity, is that financial markets are far more diverse than just the United States. As we have learned, investors who just have domestic exposure to America are neglecting about two thirds of the world’s stocks and bonds and some of the highest GDP growth rates in the world. While market weight exposure may not be appropriate for most investors, diversification across geographies remains critical to a well-diversified portfolio.

Investors overweighting portfolio assets to the country they reside is not solely an American phenomenon. In fact, home-country bias, as it is known, exists throughout the world. Many explanations have been offered as reason for home bias such as a perceived informational advantage, ease of investment, and numerous behavioral and psychological conditions. Yet, one thing remains certain: investors tend to favor investing in the country they reside and by doing so they miss out on a tremendous opportunity.

Home country bias in investor portfolios

Market Climate

Home country bias and market size remain important as investors build portfolios. Also important for consideration remains the long-term strength of several economies and how they affect markets. Participants in the second quarter of 2012 experienced another “risk-off” period as domestic equity markets had moderate losses (-2.75% for the S&P 500 and -3.47% for small cap stocks) while commodities and international stocks fell considerably more (-6.85% for the MSCI EAFE and -8.78% for the MSCI Emerging Markets). At the same time, investors continued to flock to the perceived safety of US Treasuries with the Long-Term Bond Index returning 10.32% for the quarter, hovering around all-time lows on interest rates.

The first and second quarters illustrate the schizophrenic nature of capital markets in recent years. After a strong first quarter, fears again arose across the Atlantic about the solvency of certain European nations as well as a potential slowdown in the global economy. After numerous summits, elections, and stop-gap measures, the outlook for the Eurozone remains negative but possibly manageable. The slowdown in emerging economies such as China hurt commodity prices, and investors continue to hang on US employment data in order to determine whether a global recession is imminent or just a false start. At this point, the “fat-tail” risk to the economy remains large, but central bank and government intervention continue to make a “base-case” scenario of slow but steady growth. As always, it is good to stay diversified not only across asset classes, but also geographies. Finally, below is a chart of the location of the 500 largest companies in the world. To borrow a phrase from PIMCO’s Bill Gross, the US remains “the cleanest dirty shirt.”

Location of the world's 500 largest companies

Source: Eric Platt/Business Insider, Data: Fortune. Above information has been obtained from reliable sources but no guarantee is made with regard to accuracy or completeness.

Return-Free Risk

The Long-Term Bond Market

Government bonds represent one of the oldest forms of financial securities. In the 17th century, England issued government bonds in order to finance her wars. For its part, the United States almost immediately became indebted, issuing credit in order to support the Revolution and establish its nascent union. Over the centuries, the sovereign bond market has become a staple of the financial world, and since the conclusion of the Second World War, the United States Treasury market has served as the standard for all debt markets. The US Treasury has become such a staple that many domestic investors have adopted the instruments as “risk-free return,” that is, the amount an investor can earn without taking risk. Yet a strong bond market over the last few decades, with bond yields at record lows, and the United States’ fiscal strength deteriorating, has recently made investors question that assumption. Today it may be that investors are receiving a “return-free risk” instead.

There is an absolute truism in debt markets: if the yield (the rate paid for borrowing money) on a bond rises, the price of that bond falls, and vice versa. The relationship between yield and price is not hypothetical but rather mathematical, called duration. Simply put, if a bond has a duration of 10, anytime interest rates move up 1%, the bond would go down in price 10%. This serves as the reason that bond markets are quoted in yields rather than price. With that in mind, we examine a 50-year chart of 10-year US Treasury Bond yields.

Source: Bloomberg Professional

The chart clearly displays that since the early 1980s and the Volcker-led Federal Reserve, yields on US Treasury notes have steadily fallen, indicating a strong bond market performance. Today, yields on the 10-year Treasury note sit near historic lows as investors have continued to purchase the securities for the perceived safety. The bonds do not reveal the same safety if viewed on the left side of the previous graph.

Both the world and domestic bond markets have changed dramatically from the days before the financial crisis of 2008. Many have begun to wonder aloud how much longer investors will loan money to the US Treasury for 2% annually, especially after the unprecedented amounts of both fiscal and monetary stimulus of the past years coupled with the $15 trillion of accumulated debt.

Inflation is a primary concern for debt investors, and if it begins to be recognized in the domestic economy, US Treasury holders could begin to demand more compensation and sell current holdings. The rise in yields would reverse the bullish trend over the past 30 years, however, a dramatic rise in rates would not be without a historical example (see: 1970s). The impact of rising rates for US bond investors could be amplified because yields are so low, leaving many to question the true risk they are taking. While bond yields may theoretically go extremely high (as exemplified most recently by Greece), they have, again in theory, a finite level to which they could fall: zero. It would be an almost unfathomable situation in which an investor would pay the government to loan it money for several years (thereby driving yields into negative territory). However, short time frames may be different. In the heart of the financial crisis in 2008, short-term Treasury bills (securities with less than a year to maturity at issuance) actually briefly printed a negative yield.

The term “return-free risk” for US Treasuries was coined by famed investor James Grant, editor of Grant’s Interest Rate Observer, in late 2008. In an article published in the Financial Times that year, Grant emphasized an old traders’ maxim: “There are no bad bonds, only bad prices.” In other words, Grant believed that US Treasuries were too expensive and posed a poor risk/return proposition for investors (note: according to Bloomberg, the day Grant’s insight was published, December 4, 2008, the US generic 10-year yield closed at 2.55%. As of the time of this writing, April 12, 2012, the 10-year yield closed at 2.05%. In short, it’s more expensive now than it was then).

Hypothetical 20-year Treasury Bond compared to the S&P 500

Source: Leuthold Group, Tradewinds

Numerous others have also examined the asymmetric return profile associated with longer-term Treasury bonds. In January, the Leuthold Group created an illuminating chart of a hypothetical 20-year Treasury Bond in comparison to the S&P 500. Dave Iben, who recently departed from Tradewinds, showed the chart in his quarterly letter. The results highlight the risk with longer-term US bonds. In short, if rates rise rapidly over the next few years, the long-term Treasury bond would suffer due to its duration risk. While the Leuthold bond is a hypothetical example, it illustrates an important point: long-term Treasury bonds have limited upside, with potentially a large downside.

The Fed’s Pledge

Recent domestic economic data in the United States has continued improving. Unemployment, manufacturing, consumer confidence and corporate earnings have had positive data recently. Trailing twelve month domestic earnings, as measured by the S&P 500, reached an all-time high at the end of the first quarter 2012 of over $96 of earnings per share and Bloomberg consensus estimates call for the trend to continue. Even on a real basis (inflation-adjusted) earnings are expected to reach all-time highs as soon as the second quarter 2012. Yet, even with all the solid news on the economic front the Federal Reserve remains dovish. In their most recent meeting in March, the Federal Open Market Committee (FOMC) reiterated that it anticipates “economic conditions… are likely to warrant exceptionally low levels for the federal funds rate at least through late 2014.” Even with a gradually improving economy, the Federal Reserve pledged to keep its benchmark interest rate near zero for at least two and half more years. The ramifications of such unprecedented monetary policy could have a profound impact on global markets.

Federal funds rate pledge through 2014

Source: Bloomberg Professional

Perhaps the largest concern with such accommodative monetary policy involves its inflationary tendencies. Since the financial crisis of 2008, the Federal Reserve has actively been trying to “reflate” the US economy by injecting massive amounts of funds into the money supply. The Fed Chairman, Ben Bernanke, spent a great deal of his academic career studying the Great Depression and the detrimental effects of a deflationary spiral. He has repeatedly referenced the need to avoid such a market environment, even going as far as to say the Fed should drop money from the sky during his famous (infamous?) “helicopter” speech in 2002. The explosion of central bank balance sheets to combat deflation is hardly just a domestic issue, but we will focus on the US aspect most closely. While the US economy remains below its potential output, the recent gains in economic activity concern some that the Federal Reserve may not remove at least a portion of its stimulus policies before inflation becomes problematic. Inflation, as we know from before, is bad for bond investors, and those investors with longer duration fixed income holdings (like long-term US Treasuries) could be taking on more risk than they realize.

Global central bank balance sheet growth

Source: Bianco Research, The Big Picture (ritholtz.com)

There is, of course, a counter argument to the idea that domestic monetary policy could have an inflationary outcome. The contrary side contends that the ultra-low interest rates may have slipped the United States into what Keynes referred to as a “liquidity trap.” In short, such a scenario renders monetary policy ineffective and rates remain exceptionally low. This scenario is not unprecedented: Japan has been suffering from a trap over the past twenty years. Paul McCulley, a former PIMCO portfolio manager, has already declared the United States is in a liquidity trap. James Bullard of the Federal Reserve Bank of St. Louis published a paper in 2010 called “Seven Faces of ‘The Peril'” in which he examined the possibility that the US enters a Japanese-style deflationary environment. Bullard claimed the extended low nominal interest rate environment makes the US “susceptible to negative shocks” (such as a disorderly default of a European government) which could keep interest rates low indefinitely. In other words, the Fed does not have enough “dry powder” to stimulate the economy should another crisis emerge. He concluded by stating the “U.S. is closer to a Japanese-style outcome today than at any time in recent history.”

While both scenarios above — rapidly accelerating inflation and a deflationary spiral — remain tail risks at this point (a much more plausible expectation would involve the US economy “muddling through” and slowly improving) both would have very different effects on the US Treasury market. On one hand, the inflationary scenario could have a devastating outcome for holders of long-duration bonds. Conversely, in a deflationary environment, US Treasury holders could presumably realize modest returns. A third scenario called “Stagflation” was experienced in the 1970s in which the economy stagnated while inflation rose. Again, with the US 10-year Note yielding around 2% and the uncertainty in the current market, it appears the securities have an asymmetric risk/return profile.

The Search for Yield

The low interest rate environment has presented a conundrum for investors needing current income. Where can investors find yield? In the years since Jim Grant first introduced the term “return-free risk,” a few alternatives to traditional domestic government bonds have emerged. First, investors can decrease the quality of traditional fixed income or increase the duration of credit holdings. Next, they could diversify their fixed income allocation geographically. Finally, investors could look for yield in other asset classes such as master limited partnerships or dividend paying equities.

The first method investors have attempted to increase yield involves relaxing credit quality standards of a portfolio. For example, a BBB rated corporate bond with 15 years to maturity has higher yield compared to a 10-year Treasury Note. While the yield may be greater, the risk with lower credit issues also increases. An industrial company, in theory, has more of a chance for default (i.e. not making full principal and interest payments) than a US Treasury.

Another technique for increasing interest is by lengthening maturity. By increasing maturity you increase the duration of bond holdings which actually increases a portfolio’s risk should interest rates rise in the inflationary scenario. A potential solution to reducing interest rate risk would be investment in floating-rate bonds. These bonds have much lower duration risk because the payments or principal move in correlation to interest rates. Yet, the largest issuers of these bonds are of intermediate and lower credit quality.

Next, investors may diversify their portfolios geographically by buying credit of governments throughout the world. One can generally increase yields by investing in countries that are growing at different rates. However, by allocating part of a portfolio to international fixed income, investors also take on new risks such as sovereign risk (think Greece) and currency risk. Additionally, international fixed income may present a different risk/return profile than traditional domestic fixed income.

Perhaps the most discussed solution in the media has been the introduction of altogether new asset classes to increase a portfolio’s yield. Both master limited partnerships (MLPs) and real estate investment trusts (REITs) must distribute a large portion of earnings as income to their investors, making their yields higher than some bonds. Both of these asset classes, however, have experienced high volatility in recent years so their suitability to replace fixed income may not be appropriate.

High-quality dividend paying equities have recently emerged as a popular solution for generating yield. In fact, according to Bloomberg estimates, the S&P 500 expected dividend yield is comparable to the yield on the 10-year Treasury. Investing in companies that have higher consistent dividends and diversifying the portfolio internationally could increase yields on equities even more. Take the Dow Jones Select Dividend Index, for instance. The Index has had a higher expected dividend yield than the 10-year and most recently has almost twice the yield of the 10-Year Treasury.

Dow Jones Select Dividend Index yield vs. 10-Year Treasury

Source: Bloomberg Professional

An important fact to remember about investing in dividend-oriented companies is that they ARE NOT BONDS. While dividend-paying equities may serve as an appropriate complement to a stock portfolio, they may not be appropriate for replacing a fixed income position. First, they have a great deal of volatility. In an April 12, 2012 article by Jason Zweig in The Wall Street Journal, “The Dangers of Dividend Funds,” he points out that, according to Morningstar, in the fourth quarter 2008 dividend-oriented mutual funds fell 20.2% while the S&P 500 as a whole lost 21.9%. While Zweig correctly notes that over longer periods dividend oriented strategies have had less volatility than broad based equity markets, he also alludes to a far more important point: correlation, and the benefits low correlated asset classes can have on a portfolio. In the final quarter of 2008, while equity markets underwent turmoil, Zweig notes the Barclays Capital US Treasury index gained 8.75%. In other words, historically, when equities “zig,” US Treasuries “zag” (or at least don’t “zig” as much). While dividend focused equity strategies may be appropriate in a portfolio, it is important to remember that they are significantly different from investing in bonds.

Conclusion — High Diversification / Low Correlation

The US Treasury market has experienced a strong bull market over the past three decades. The financial crisis of 2008 has driven many maturities in the market to record low yields as investors clamored for a perceived safe haven in US government bonds. The record low yields present investors with an asymmetric risk/return profile; that is, investors face potentially large downside to their investment while only modest upside.

Unprecedented monetary policy in both the US and around the world has complicated all markets and could have a huge influence on the Treasury markets in the future. Finally, investors have attempted to find income in various asset classes but each presents investors with new risks.

Diversification can add safety to a portfolio, especially when diversifying between assets with low correlation. The effect of correlation on an investment portfolio is the secret to true diversification. The end result is that the whole portfolio, diversified with low correlation assets, can become safer than the sum of its parts. By blending together portfolios with the different asset classes mentioned in this report, investors may be able to protect capital, and enjoy a higher yield than a non-diversified, all bond portfolio.

Finally, a bit of lagniappe (and admittedly a bit off subject): Morgan Housel of the financial website “The Motley Fool” put together a list of 50 amazing numbers from the economy. We thought we would share a few of them that we found interesting.

  • A record $6 billion will be spent on the 2012 elections, according to the Center for Responsive Politics. Adjusted for inflation, that’s 60% more than the 2000 elections.
  • In 2010, nearly half of Americans lived in a household that received direct government benefits. That’s up from 37.7% in 1998.
  • As the market was “flat” from 2000 to 2010, S&P 500 companies paid out more than $2 trillion in dividends.
  • According to Goldman Sachs’ Jim O’Neill, China’s growth creates the equivalent of a new Greece every 90 days.
  • Americans age 60 and older owe $36 billion in student loans.
  • Just five companies — Apple, Microsoft, Cisco, Google, and Pfizer — now hold nearly one-quarter of all corporate cash, equal to more than a quarter-trillion dollars.
  • Total government employment has shrunk by almost 700,000 since 2009.
  • For the first time since 1949, the U.S. is now a net exporter of fuel products like gasoline and diesel.
  • The period from March 2009 to March 2012 was one of the strongest three-year market rallies in history — stronger, in fact, than the 1996-1999 bull market.
  • Adjusted for inflation, the bursting of the housing bubble destroyed wealth equal to half of a 1950s America.
  • As the economy tanked in 2009, the top 25 hedge fund managers collectively earned $25.3 billion. On average, that works out to about $2,000 a minute for each manager.
  • Household debt payments as a percent of income are now the lowest since 1994.

Dynamic Risk Management

Grantham’s Cautious Outlook

Jeremy Grantham is one of the current asset allocation gurus on Wall Street. He was co-founder of Batterymarch Financial Management in 1969 prior to founding his current firm, GMO. Mr. Grantham has been featured in Forbes, Barron’s and Business Week and is routinely quoted by the financial press. He earned his undergraduate degree from the University of Sheffield (U.K.) and an M.B.A. from Harvard Business School.

Jeremy Grantham projects 10 flat and volatile years for stocks from the average of 10 previous bubble bursts.

As one can see, the historic precedent for the equity market over the next decade would not thrill most investors. Grantham, for his part, has a few areas in which he sees the potential for returns (or at least the avoidance of losses). He calls for a normal weighting to the global equity markets, but one should steer clear of low quality domestic stocks. Larger companies with sustainable cash flows and solid business models will be able to deliver higher returns over the next seven years than their riskier small cap counterparts. In fact, Grantham calls for a negative real return for small capitalization stocks.

Safety, as it turns out, serves as Grantham’s primary theme. He recommends investors “tilt” their portfolios toward safer assets wherever possible. For instance, with interest rates at a record low, Grantham suggests avoiding duration risk in bonds. The price of bonds move inversely with interest rates; so if interest rates fall, the bond is worth more and vice versa. When, not if, interest rates rise, bondholders with more duration (interest rate sensitivity) will suffer more than those whose bonds have shorter duration. His firm’s seven year asset class forecast predicts most fixed income asset classes will also have negative real returns, with Emerging Market Debt as the exception returning a modest real 1.3%. Grantham also stresses that investors should not be too proud to hold “substantial” cash reserves over the foreseeable future. Finally, Grantham is a firm believer in limited natural resources on the planet. In the past, he has eloquently defended the Malthusian argument that exponential population growth and economic development will strain many, if not all, of Earth’s natural reserves. Subsequently, as an investor, he has taken interest in commodities as well as companies that help bring them to market. Grantham recognizes that volatility in commodities makes it difficult for many investors, therefore, he is constructive over the long-term (10 years) on many natural resources. He does admit, however, that there is a coin flip’s chance that the current global slowdown and normalized weather patterns may provide a lower entry point for investors. That is, commodities very well may see price declines in the short-term.

Don’t Fight the Fed

While Grantham has a less than rosy outlook over the next seven to ten years, numerous factors such as fiscal policy, a global economic slowdown, a trade war, unexpected new technologies and industries or a multitude of other factors could dramatically change the forecast. Perhaps the most influential factor for the United States is the Federal Reserve’s monetary policy. Certainly over the past few years, the Fed has had a profound influence on markets as the chart from Doug Short (dshort.com) below illustrates.

S&P 500 performance versus Fed monetary policy actions

Source: Bloomberg Professional

The graph displays that while fiscal policy (PDCF, TALF, TARP, etc.) was not immediately effective in the markets, the Fed’s zero interest rate policy as well as quantitative easing (QEs) had an enormous influence. The S&P 500 rallied significantly during both QE periods in which the Fed injected more money into the economy, exhibiting investors’ drive for more risky assets. On the other hand, at the end of each easing period, the stock market fell as investors became more risk averse.

The key question becomes what will be the Fed’s policy going forward. The central bank has already declared its intention to keep their benchmark interest rate near zero through at least 2013. As the economy stumbles again with threats of a credit crisis in Europe, would the Fed undergo more quantitative easing programs, and would it have the same effect of driving investors into riskier assets? The consensus remains that while further monetary stimulus may occur in the near term, over the intermediate term the Fed will significantly reduce its balance sheet, which has ballooned over three times since 2007. Whatever happens over the next few years with monetary policy, investors should remember the old maxim: “Don’t Fight the Fed!”

Federal Reserve balance sheet growth

Implications for Asset Allocation

The common thread between Grantham, central bank policy, and market analysts as a whole is that volatility and lower real returns from traditional assets will be around for the next few years at a minimum. Thus, it is important for institutions to examine their return expectations and ways to meet their required investment returns.

Most institutional investors such as endowments, foundations, and pension plans, have an investment goal of 5% over the rate of inflation. This is in line with the actuarial interest rate assumption of most pension plans which averages 7.5% to 8.0% nationwide, and accomplishes the most common spending policy of endowments and foundations, which is 5%, plus keeping the principal indexed to inflation.

Asset allocation has always been one of the most important decisions investors make, and with the volatility and uncertainty of the current environment, it is one of the most difficult. Studies indicate that the asset allocation decision accounts for a majority of an investor’s experience in both risk and return. Most sophisticated investors have an asset allocation policy including a target allocation for each asset class, and an allowable range collared around each target. This is known as Strategic or Static Asset Allocation. Over long periods of time Strategic Asset Allocation has accomplished the goals of most investors. However, long term is more than 25 years! In the shorter term the investment goals have been difficult to achieve with only a Strategic Asset Allocation system, and the traditional 60% equity / 40% fixed income indexed strategy has failed to meet the goal.

The Importance of Asset Allocation

The chart below displays various asset class returns over the past 15 years. As one can see, returns vary greatly year to year. For instance, look at emerging market equities. In 2007, the index returned nearly 40%. The next year, however, it fell over 53% and in 2009 it rose 79% (though still below its level at the end of 2007). With that much volatility, many investors lost faith in the emerging market asset class at the wrong time and missed the subsequent rally in 2009. In fact, a recent study by J.P. Morgan Asset Management found that stocks and bonds both returned 7.7% and 6.1% respectively over the last 20 years. There is no combination of stocks and bonds over this period that would earn the required 8% return of most pensions, foundations and endowments. J.P. Morgan also found that an average investor returned a mere 2.6% over this period. Clearly, investors buy and sell assets at less than ideal times.

Asset class returns by year, 15-year period
Asset class returns quilt chart

Past performance is no guarantee of future results. This graphic is for illustrative purposes only and not indicative of any specific investment. An investment cannot be made directly in an index.

Active Asset Allocation

So what steps can institutional investors take to meet their return requirements? For decades, a blend of stocks and bonds, traditional assets, appeared to be the answer. Over the past fifteen years, however, the mix of 60% stocks and 40% bonds has not met the common benchmark of inflation plus 5% for spending. The next step involved diversifying into new asset classes. These asset classes may have included foreign securities, real estate, commodities and master limited partnerships (MLPs). By doing so, investors could beat the inflation plus 5% benchmark, albeit by taking on slightly more risk. As illustrated in the asset class table above, many of the new asset classes added had more volatility and during times of market stress like 2008, they did not offer the correlation benefits investors had previously expected.

The final step to a stronger asset allocation, which should be beneficial with the expected market turbulence over the next few years, is to add a level of dynamic risk management. Equitas’ dynamic risk management tool aims to identify asset classes that exhibit either positive or negative intermediate trend on a monthly basis. In other words, invest in asset classes that appear to be going up for the next month and do not invest in those that appear to be going down.

While the dynamic risk management tool may be extremely helpful in identifying investments, it does not complete the active asset allocation process. In order to build a more efficient portfolio, assets should be rebalanced from the negative (non-invested) to the positive asset classes. A hypothetical back-test of this approach shows that Active Asset Allocation both lowers risk and increases return historically.

Ike’s Warning Revisited

On the 50th anniversary of President Eisenhower’s farewell address, his thoughts on the “military-industrial complex” still resonate today, says his grandson David Eisenhower.

Many investors today do not remember the wise words of Dwight D. Eisenhower in his farewell address. This year marks the 50th anniversary of President Eisenhower’s famous speech, a Presidential address considered one of the most noteworthy — and prophetic — ever given. Often compared with John F. Kennedy’s historic inaugural three days later, Eisenhower’s farewell peered from 1961 down “the long lane of history yet to be written.” Like Kennedy, he spoke about the responsibilities and challenges confronting popular government, including his famous call to “guard against the unwarranted acquisition of influence, whether sought or unsought, by the military-industrial complex.”

In a recent Bloomberg BusinessWeek article, David Eisenhower, director of the Institute for Public Service at the University of Pennsylvania’s Annenberg Public Policy Center, reflected on his grandfather’s famous speech given when David was only 12 years old. An excerpt:

“We… must avoid the impulse to live only for today, plundering for our own ease and convenience the precious resources of tomorrow. We cannot mortgage the material assets of our grandchildren without risking the loss also of their political and spiritual heritage. We want democracy to survive for all generations to come, not to become the insolvent phantom of tomorrow.

In the councils of government, we must guard against the acquisition of unwarranted influence, whether sought or unsought, by the military-industrial complex. The potential for the disastrous rise of misplaced power exists and will persist. We must never let the weight of this combination endanger our liberties or democratic processes. We should take nothing for granted. Only an alert and knowledgeable citizenry can compel the proper meshing of the huge industrial and military machinery of defense with our peaceful methods and goals, so that security and liberty may prosper together.

Every gun that is made, every warship launched, every rocket fired signifies, in the final sense, a theft from those who hunger and are not fed, those who are cold and are not clothed. This world in arms is not spending money alone. It is spending the sweat of its laborers, the genius of its scientists, and the hopes of its children.”
President Dwight D. Eisenhower, Farewell Address, January 1961

Having witnessed, as the Supreme Allied Commander in World War II, what can happen when a totalitarian movement succeeds in reducing citizenship to spectatorship, Eisenhower believed active and effective citizens were the best antidote to fear. He believed in popular control of institutions formed to meet great problems. Taking office a mere eight years after the war and at the height of the Cold War, he worked to defuse international tensions and to restore normalcy in national affairs, believing that prosperity and freedom could not survive a state of perpetual crisis. This meant downsizing the military establishment, without relaxing the guard against the Soviets, and reversing the trend toward big government.

He succeeded in cutting government spending, especially defense spending. Budgets were balanced and the share of economic output consumed by the defense industry fell from more than 40 percent of gross domestic product in 1945 to roughly 10 percent in 1961, even though defense issues — and scares — predominated in his second term.

The surprise in Eisenhower’s farewell speech was the way he likened the defense industry to other pressure groups in Washington, as a “complex” serving a vital role but positioned to corrupt national policy by capitalizing on public anxiety and credulity.

My grandfather seldom talked about the speech after he delivered it, and as a 12-year-old when he left office, I was oblivious to it. When I started hearing about it years later, Republican friends suggested the warning about the military-industrial complex, coming from a conservative military man, must have been just words written for him by a speechwriter. They didn’t know him as I did. The striking feature of his speech is its authenticity. Watching segments of it today, no one who knew Dwight Eisenhower can doubt the earnestness of his words or that they are his own. The underlying themes reflected his experience and his advice to friends and family, in which he always stressed education, dedication to job, and lively interest in public affairs. A moralist, Eisenhower prized hard work and self-reliance. His farewell message conveyed his deeply held values: his dedication to America’s “adventure” in free government and our “charted course toward permanent peace and human betterment.”

Because of burgeoning deficits and the estimated trillion dollars spent annually on all aspects of national security, Eisenhower’s warnings about prudence and economy resonate today. His general reflections on the challenges facing democracy will pertain for as long as Americans value democratic self-government. Were he leaving office today, Eisenhower might well speak of globalization and the social, political, and economic implications of the trillions of dollars managed by four or five New York financial institutions, a concentration of power as potentially dangerous as the military-industrial complex of his day.

Ike was not the first to identify that complex, nor the first to warn of the self-interested and self-perpetuating nature of large corporate-public “complexes.” But he memorably spoke of these things as a President while freshly affirming a basic truth valid then and valid today: that America’s freedoms and our quality of life ultimately depend on tens of millions of active citizens, a sense of confidence in the future, and mutual respect.

The Consumer, and the Government

If we look at the collective US consumer balance sheet, the consumer looks healthy. Consumer assets are much higher than liabilities, the personal savings rate is going up for the first time in 30 years, and the household debt service ratio is back to where it was in 1980 according to research from JPMorgan.

US consumer balance sheet

The federal government is a different story. Continued deficit spending and the accumulated debt are unhealthy. The $14.5 trillion debt is well known, but most of the government liabilities are off balance sheet. Social programs like Social Security, Medicare, and Medicaid liabilities are not seen on the radar of a balance sheet. Estimates of these liabilities run in the $50 to $70 trillion range. Inflation is one of the tools the government has used over the last 50 years to reduce the value of future liability payments.

2011 federal budget

The next two charts contain tables of price comparisons from 1960 to 2010. For some of us, this will be a walk down memory lane and bring back remembrances of the “good old days.” For all of us, it should be a stark contrast of the effect of inflation and the weakening dollar on our purchasing power.

One example is particularly strong. The price of a gallon of gas in 1960 was $0.31. In 2010 it was $2.35. This is a large change in the price of a commodity and it demonstrates the powerful effect of inflation and the change in our cost of living. This is a period where the rate of inflation averaged 4.1%.

If you take out the effect of inflation and use 2009 dollars as the constant value for the comparison, the price of gas in 1960 would be $2.37! Therefore, this large rise in gas prices has only kept up with inflation. There has been no real increase (growth above inflation) in the price of gasoline.

On the other hand, in 1960 the price of gas and the price of a haircut was about the same. Today a haircut runs $15 to $25. This is real growth which makes the price of all this expensive gasoline seem relatively cheap.

Price comparisons, 1960 to 2010
Price comparisons, 1960 to 2010, continued

Protecting against inflation is always important and may once again become as important as it was in the hyperinflation of the 1970s. We have calculated the correlation of different asset classes to inflation. Assets that are correlated positively to inflation, like Commodities, MLPs, TIPS, and Hedge Funds are best for protection against inflation.

Correlation of asset classes with inflation

Play Your CARDs Right

  • Correlation
  • Asset Allocation
  • Rebalancing Reduces Risk
  • Diversification
“If you play your cards right, things are going to happen in the long run. In the short run, it is anybody’s guess.”
“An investment in knowledge pays the best interest.”
Benjamin Franklin

Rachel Kaplan created what we refer to as the Periodic Table of Asset Classes. Rachel analyzed performance returns for seventeen different asset class indices and created a chart that ranked each sector’s performance for each year for the 20 year period from 1991 through 2010. Besides creating something that looks very familiar to anyone who ever had a high school science class, she did a great job visually depicting the power of diversification. The random pattern of the colors in the chart graphically illustrates what investment gurus have been telling us for decades: don’t bet too heavily on yesterday’s winners, and don’t completely discount yesterday’s losers.

Rachel’s research got us thinking about the power that diversification and rebalancing provide, when used together, to reduce risk and to increase returns. When combined with Equitas’ research on correlation, asset classes and risk, their power to affect a desired outcome on a portfolio is even greater. We coined the term CARD (Correlation, Asset Allocation, Rebalancing/Reducing Risk and Diversification) to better capture the flavor of each of these inputs in portfolio engineering.

Correlation

In the world of finance, correlation is a statistical measure of how two securities move in relation to each other. We do extensive correlation research as we think about risk and returns in clients’ portfolios.

Correlation is computed into what is known as the correlation coefficient, which ranges between -1 and +1. Perfect positive correlation (a correlation coefficient of +1) implies that as one security moves, either up or down, the other security will move in lockstep in the same direction. Alternatively, perfect negative correlation means that if one security moves in either direction the security that is perfectly negatively correlated will move in the opposite direction. If the correlation is 0, the movements of the securities are said to have no correlation; they are completely random.

A well balanced portfolio will have multiple asset classes that have low correlation to one another. When done correctly, the art and science of blending a variety of low correlated asset classes allows a portfolio the opportunity for a smoother ride than otherwise possible with a more concentrated blend of asset classes. If a portfolio is diversified among asset classes that are all perfectly correlated (+1), there is no benefit to the diversification. Correlation is the power behind diversification.

“Goodness is the only investment that never fails.”
Henry David Thoreau

Asset Allocation

An asset class is a group of securities that exhibit similar characteristics, that behave similarly in the marketplace, and that are subject to the same laws and regulations. The three main asset classes are equities (stocks), fixed-income (bonds) and cash equivalents (money market instruments), however when Equitas researches and constructs a portfolio, we include as many as sixteen different classes. They may include international securities, MLPs, real estate, and commodities among others.

The terms asset classes and asset class categories are often incorrectly used interchangeably. In other words, describing large-cap stocks or short-term bonds as asset classes is incorrect. These investment vehicles are asset class categories, and are used to increase diversification.

Each asset class is expected to reflect different risk and return investment characteristics, and will perform differently in any given market environment. Using multiple asset classes in portfolio construction helps achieve a lower risk, less correlated portfolio, and it is the first step in diversification. Our return attribution analysis indicates that proper asset allocation is the most powerful tool in portfolio construction.

“The time of maximum pessimism is the best time to buy and the time of maximum optimism is the best time to sell.”
Sir John Templeton

Rebalancing Reduces Risk — The Three “Rs”

To rebalance is to bring a portfolio back to its original asset allocation mix. Though it may feel counterintuitive, rebalancing entails selling winners and buying underperformers. This is necessary because over time, allocations to asset classes and individual managers become out of alignment with investment policy guidelines. Some asset classes will grow faster than others. Rebalancing ensures that a portfolio is not over or under weighted in relation to guidelines. By selling outperformers and reinvesting in laggards, a portfolio locks in its gains, and re-invests in underperforming sectors while they are “on sale.” As long as the initial investment thesis still rings true, and there is no fundamental change in a manager that may require putting them on a “watch” list, buying on dips is a great way to reposition a portfolio for increased alpha.

There are three different methods to rebalance a portfolio:

  • Periodic: Pick a period, such as annually, and sell investments from over-weighted asset categories and use the proceeds to purchase investments for under-weighted asset categories.
  • Event Driven: Whenever an asset class falls out of the acceptable range noted in the Investment Policy, rebalance the portfolio back to the Policy’s Target allocation.
  • Cash Flow: Use new contributions and withdrawals to rebalance the portfolio. Purchase new investments from cash flows within the portfolio to buy under-weighted asset classes, and make the sales from the appreciated, over-weighted asset classes.

The Cash Flow method is the smoothest for money managers. Event Driven has the greatest impact on performance. We use all three methods at Equitas. Regardless of how it is achieved, a portfolio should be rebalanced on a regular basis in order to optimize returns. Equitas monitors clients’ portfolios continually to seize rebalancing opportunities.

“Rule No.1: Never lose money. Rule No.2: Never forget rule No.1.”
Warren Buffett

A fundamental idea in finance is the relationship between risk and return. The greater the amount of risk that an investor is willing to take on, the greater the potential return. In other words, investors need to be compensated for taking on additional risk.

For example, a U.S. Treasury bond is considered to be one of the safest (risk-free) investments and, when compared to a high yield bond, provides a lower rate of return. A corporation that can only borrow in the “junk” market is much more likely to go bankrupt than the U.S. government. Because the risk of investing in a junk bond is higher, investors expect a higher rate of return.

A well-constructed portfolio consists of multiple asset classes that are positioned on various spots on the risk return spectrum. When done correctly, this lowers overall portfolio risk while optimizing returns. The whole portfolio becomes safer than the sum of the parts.

“Money is like manure. You have to spread it around or it smells.”
J. Paul Getty

Diversification

Diversification is a risk management technique that mixes a wide variety of asset classes within a portfolio. The rationale behind this technique contends that a portfolio of different kinds of investments will, on average, yield higher returns and pose a lower risk than any individual investment found within the portfolio. Diversification strives to smooth out risk events in a portfolio so that the positive performance of some investments will neutralize the negative performance of others. Therefore, the benefits of diversification will hold only if the asset classes and managers in the portfolio are not perfectly correlated.

Our asset allocation studies have shown that maintaining a well-diversified portfolio of asset classes and managers yields the most cost-effective level of risk reduction. We strive to provide the lowest possible level of volatility that still allows a portfolio to achieve its return targets.

Diversification benefits are gained by investing in asset classes that have low correlation to one another. For example, an economic downturn in the U.S. economy may not affect Japan’s economy in the same way; therefore, having Japanese investments would allow an investor to have a cushion of protection against losses due to an American economic downturn. This happened very effectively in the decade of the 1970s.

Most investors wait for investments to go up and then they buy after the investments have appreciated. Investors tend to buy what they wished they had bought. Conversely, they sell after the investment has gone down. Correlation, Asset Classes, Rebalancing, and Diversification are tools to help avoid these problems. Playing your CARDs right can keep you from falling into these traps and yield a more prosperous investment experience. Equitas Capital Advisors is proud to serve as your investment management consultant. We appreciate your business, and value the trust and confidence that you place in us. We look forward to continuing to engineer and deliver investment solutions to you for years to come.

Recognizing an Inflection Point (When You See One)

“Those that fail to learn from history, are doomed to repeat it.”
Winston Churchill
“History teaches us that man learns nothing from history.”
Georg Wilhelm Friedrich Hegel
“Predictions are hard to make, especially about the future.”
Yogi Berra

These are macroeconomic visions which we have been writing about in the KnowRisk Commentary and we concur with the contradictory quotes. Forget predicting the future, observing the present is hard enough and very few people do it. David Iben, the Chief Investment Officer of Tradewinds Global Investors, a $30 billion global investment manager that we utilize for many of our clients, recently stated:

“While bottom-up analysis and valuation remains absolutely prerequisite to sound investing, doing so while remaining oblivious to bubbles and other major macroeconomic dislocations in the economy equates to the proverbial ‘rearranging of the deck chairs on the Titanic.'”
David Iben, Tradewinds Global Investors

In 1929, it really didn’t matter what stocks you picked, what mattered was that you shouldn’t own stocks. During the ‘guns and butter’ days of LBJ, not owning bonds for the next fifteen years was much more important than picking the ‘right’ bonds to own. In the 1970s John Templeton avoided the US bear market because he found better bargains in Japan. He returned to US stocks in the 1980s since Japan had appreciated so much it was no longer a bargain. In 1980, with Paul Volcker reining in the money supply, getting out of gold, oil and other commodities should have been at the forefront of everyone’s mind. In 1999, recognizing that there was no growth rate high enough to make the math work for investors in tech stocks was all that needed to be done. Analyzing tech stock fundamentals was generally a waste of time until 2002 (except for short-sellers). During the 2005 through 2008 period, asking the question — will mortgages on overpriced houses, extended to unqualified, over-extended borrowers likely be repaid? — was all that analysts needed to do when assessing financial stocks.

Which brings us to 2011!

The most important analysis that a prospective investor can perform today is to ask the question: will governments that have obligations that far exceed their ability to honor, eventually make good on them?

If you were considering making a loan to your neighbor for 10 years, you would want some data. High on the list might be: other obligations, integrity, employability, assets/collateral, and income. Low on the list (if there at all) might be: what do the government bureaucrats claim was the CPI or unemployment rate last quarter, what was the ‘output gap,’ whether Bernanke is speaking this week, or what economists are suggesting next quarter’s growth rate will be. Why should loans to governments be treated differently? That Japan, the U.S., and the U.K. won’t honor their commitments is a given in the opinion of David Iben who says:

“When and how they renege is a more legitimate topic. We do not know the answer, we do believe that loaning money to them for 10 years at a sub-3% yield is madness! While it may or may not ultimately work out for buyers, the risk is far greater than the prospective return.”
David Iben, Tradewinds Global Investors

You might even say you are buying return free risk, instead of risk free return.

Our government’s management of our fiat currency has resulted in a loss of purchasing power exceeding 90 percent over the past half-century. In other words, the millionaire from 50 years ago is equivalent to a deca-millionaire now (and probably the hecto-millionaire of the not too distant future). It is likely even more pronounced if one believes that purchasing power has declined even more than what the CPI fesses up to. It is highly likely that debasement over the next half century will be no less than it was during the past half-century. In addition to preservation of capital, investors must be mindful of preservation of wealth! The mounting national debt is a potential danger to the long term health of the US economy. What once seemed unthinkable — that one day the United States government would no longer be accorded the highest credit rating — is now not only thinkable, but increasingly probable.

“I am concerned about the unsustainability of our long-term situation.”
Peter G. Peterson, Co-founder, Blackstone Group

said Peter G. Peterson, a co-founder of the Blackstone Group and a prominent deficit critic, in a recent New York Times article.

In a quarterly report on the nation’s credit risk, Moody’s Rating Agency said there was an increasing probability of revising its outlook on its Aaa rating for the United States to negative from stable within the next two years if no action were taken. That stops well short of actually reducing the rating. But even a small revision, if it comes, would probably rattle the financial markets and might even hamper America’s ability to borrow the money it needs to finance its deficit. Moody’s has been rating United States government debt since 1917, and has always rated it Aaa. Within the last 20 years and counting (known as the “lost decade”), Japan’s debt rating has gone from Aaa to A and is only back to Aa.

As an American, I’d like to see us return to sound value, more production and less consumption, a hard currency and a government that doesn’t have the authority to saddle our grandchildren with debt. If we must spend, why not invest in our future: energy independence, modern airports and roads, education, water conservation, mass transportation, and other infrastructure?

While many countries of the emerging markets are now embracing their own version of the “American Dream,” many Americans are asking, “Have we outsourced the ‘American Dream’?” Possibly. But with turmoil comes opportunity. As long term investors, we must find ways to leverage the lessons from the past to maximize our returns going forward. Rest assured that Equitas will continue to search the globe in 2011 and beyond for the most profitable investment themes and best managers to execute those themes so that our clients will continue to have the tools necessary to navigate the perils that invariably lie ahead and so that they may prosper into the future.

Economic Indicators

Financial Signposts

An economic indicator is simply any economic statistic, such as the unemployment rate, Gross Domestic Product, or the inflation rate, which indicate how well the economy is doing and how well the economy is going to do in the future. If a set of economic indicators suggest that the economy is going to do better or worse in the future than they had previously expected, investors may decide to change their investing strategy.

To understand economic indicators, we must understand the ways in which economic indicators differ. There are three major attributes each economic indicator has:

Relation to the Business Cycle / Economy

Economic Indicators can have one of three different relationships to the economy:

  • Pro-Cyclic: A pro-cyclic (or pro-cyclical) economic indicator is one that moves in the same direction as the economy. So if the economy is doing well, this number is usually increasing, whereas if we’re in a recession this indicator is decreasing. The Gross Domestic Product (GDP) is an example of a pro-cyclic economic indicator.
  • Counter-Cyclic: A counter-cyclic (or counter-cyclical) economic indicator is one that moves in the opposite direction as the economy. The unemployment rate gets larger as the economy gets worse so it is a counter-cyclic economic indicator.
  • Acyclic: An acyclic economic indicator is one that has no relation to the health of the economy and is generally of little use. The number of home runs the New York Yankees hit in a year generally has no relationship to the health of the economy, so we could say it is an acyclic economic indicator.

Frequency of the Data

In most countries GDP figures are released quarterly (every three months) while the unemployment rate is released monthly. Some economic indicators, such as the Dow Jones Index, are available immediately and change every minute.

Timing: Leading, Lagging, and Coincident Indicators

Economic Indicators can be leading, lagging, or coincident which indicates the timing of their changes relative to how the economy as a whole changes. Three timing types of economic indicators:

  • Leading: Leading economic indicators are indicators which change before the economy changes. Stock market returns are a leading indicator, as the stock market usually begins to decline before the economy declines and they improve before the economy begins to pull out of a recession. Leading economic indicators are the most important type for investors as they help predict what the economy will be like in the future.
  • Lagged: A lagged economic indicator is one that does not change direction until a few quarters after the economy does. The unemployment rate is a lagged economic indicator as unemployment tends to increase for 2 or 3 quarters after the economy starts to improve.
  • Coincident: A coincident economic indicator is one that simply moves at the same time the economy does. The Gross Domestic Product is a coincident indicator.

Next we will look at some of the economic indicators distributed by the U.S. Government.

Many different groups collect and publish economic indicators, but the most important American collection of economic indicators is published by The United States Congress. Their Economic Indicators are published monthly and are available for download in PDF and TEXT formats. The indicators fall into seven broad categories:

  • Total Output, Income, and Spending
  • Employment, Unemployment, and Wages
  • Production and Business Activity
  • Prices
  • Money, Credit, and Security Markets
  • Federal Finance
  • International Statistics

Each of the statistics in these categories helps create a picture of the performance of the economy and how the economy is likely to do in the future.

Total Output, Income, and Spending

These tend to be the broadest measures of economic performance and include such statistics as:

  • Gross Domestic Product (GDP)
  • Real GDP
  • Implicit Price Deflator for GDP
  • Business Output
  • National Income
  • Consumption Expenditure
  • Corporate Profits
  • Real Gross Private Domestic Investment

These statistics are all updated quarterly. The Gross Domestic Product is used to measure economic activity and thus is both pro-cyclical and a coincident economic indicator. The Implicit Price Deflator is a measure of inflation. Inflation is pro-cyclical as it tends to rise during booms and falls during periods of economic weakness. Measures of inflation are also coincident indicators. Consumption and consumer spending are also pro-cyclical and coincident.

US unemployment rate over time

Employment, Unemployment, and Wages

These statistics cover how strong the labor market is and they include the following:

  • The Unemployment Rate
  • Level of Civilian Employment
  • Average Weekly Hours, Hourly Earnings, and Weekly Earnings
  • Labor Productivity

These statistics are all updated monthly. The unemployment rate is a lagged, counter-cyclical statistic. The level of civilian employment measures how many people are working so it is pro-cyclic. Unlike the unemployment rate it is a coincident economic indicator.

The following graph illustrates the Unemployment Rate under the last four Presidential administrations.

Unemployment rate under the last four Presidential administrations

Also, the rate of Job Creation under these same Presidential administrations proves interesting.

Job creation under the last four Presidential administrations

Production and Business Activity

These statistics cover how much businesses are producing and the level of new construction in the economy:

  • Industrial Production and Capacity Utilization
  • New Construction
  • New Private Housing and Vacancy Rates
  • Business Sales and Inventories
  • Manufacturers’ Shipments, Inventories, and Orders

These statistics are all updated monthly. Change in business inventories is an important leading economic indicator as they indicate changes in consumer demand. New construction including new home construction is another pro-cyclical leading indicator which is watched closely by investors. A slowdown in the housing market during a boom often indicates that a recession is coming, whereas a rise in the new housing market during a recession usually means that there are better times ahead.

Housing starts over time
Existing home sales over time

Prices

This category includes both the prices consumers pay as well as the prices businesses pay for raw materials and include:

  • Producer Prices
  • Consumer Prices
  • Prices Received and Paid by Farmers

Consumer prices other than the cost of food and energy rose slightly in May after staying flat in April while the index of leading economic indicators barely rose in May after no change in April. Taken together, the data confirm once again that the U.S. economy is making a painfully slow exit out of recession.

Consumer prices over time
Producer prices over time

These statistics are all updated monthly. These measures are all measures of changes in the price level and thus measure inflation. Inflation is pro-cyclical and a coincident economic indicator.

While the price of small items such as haircuts and boxes of cereal seems to be going up, the bigger driver of inflation is wages, and on that score, we are clearly in a deflationary environment. Most workers aren’t getting wage increases; rather, they’re getting laid off or working fewer hours. The Federal Reserve is much more concerned about inflation than deflation, but the Fed has to walk this tight wire right now.

The consumer price index (CPI) for May declined 0.2%, posting a 2.0% increase over the last 12 months, the U.S. Bureau of Labor Statistics (BLS) reported in mid-June. The CPI is a major indicator of inflation, and the recent figures show a striking lack of price pressure.

Fighting inflation is a matter of simply raising rates, but deflation is harder to fight. Generally, the government prints money and banks lend more and people spend more, but the dollar would be worth less, which would be bad for the economy and interest rates.

Money, Credit, and Security Markets

These statistics measure the amount of money in the economy as well as interest rates and include:

  • Money Stock (M1, M2, and M3)
  • Bank Credit at All Commercial Banks
  • Consumer Credit
  • Interest Rates and Bond Yields
  • Stock Prices and Yields

The following graphic illustrates the state of the Federal Budget Surplus/Deficit under the most recent four Presidential administrations.

Federal budget surplus/deficit under the last four Presidential administrations

These statistics are updated monthly. Nominal interest rates are influenced by inflation, so like inflation they tend to be pro-cyclical and a coincident economic indicator. Stock market returns are also pro-cyclical but they are a leading indicator of economic performance.

Federal Finance

These are measures of government spending and government deficits and debts:

  • Federal Receipts (Revenue)
  • Federal Outlays (Expenses)
  • Federal Debt

These statistics are updated annually. Governments generally try to stimulate the economy during recessions and to do so they increase spending without raising taxes. This causes both government spending and government debt to rise during a recession, so they are countercyclical economic indicators. They tend to be coincident to the business cycle.

International Trade

These are measures of how much the country is exporting and how much they are importing:

  • Industrial Production and Consumer Prices of Major Industrial Countries
  • U.S. International Trade In Goods and Services
  • U.S. International Transactions

US trade deficit over time

When times are good people tend to spend more money on both domestic and imported goods. The level of exports tends not to change much during the business cycle. So the balance of trade (or net exports) is counter-cyclical as imports outweigh exports during boom periods. Measures of international trade tend to be coincident economic indicators.

While we cannot predict the future perfectly, economic indicators help us understand where we are and where we may be headed.

Commodities

Additional Diversification for an Investment Portfolio

In the past, the mere mention of “investing in commodities” conjured up images of being fleeced by ruthless speculators in the blink of an eye.

However, over the last few years, the emergence of a wide variety of investible commodity indices and other commodity linked assets have rapidly increased, resulting in an increased demand for commodity based products.

Different Commodity Categories Exist

Commodities consist of raw materials, which are used to create products for consumer use. Commodities include energy products such as oil and natural gas, agricultural products such as corn and wheat, industrial and precious metals, and livestock.

  • Energy — Crude oil, natural gas, and heating oil
  • Precious Metals — Gold, silver and platinum
  • Industrial Metals — Copper, aluminum, zinc and nickel
  • Agriculture — Corn, wheat, coffee, and soybeans
  • Livestock — Live cattle, feeder cattle, and lean hogs

In addition, other commodities also known as softs are comprised of items such as cotton, sugar and cocoa that cannot be stored for long periods of time.

Ways to Gain Exposure to Commodities

Commodity investments are vehicles used by investors to gain exposure to commodities and commodity futures. There are a number of ways investors can gain exposure to commodities.

Option One: Buying Physical Commodities — The purchase of the physical commodity is one approach to investing in commodities. For practical purposes, it may not be feasible for an investor to buy and hold actual bushels of corn or barrels of oil. Transactions in commodities carry a high degree of risk, and a substantial potential for loss. An investor should carefully consider whether this type of trading is appropriate in light of their experience, objectives, financial resources and other relevant circumstances.

Option Two: Investing in Stocks of Companies That Produce Commodities — Investors have the option of owning stocks of a firm that derives its revenue from the sale of physical commodities. Investors may pick a certain sector such as oil and natural gas, mining, or agriculture. A few examples of such companies are oil exploration companies, gold mining companies, companies that specialize in mining minerals or metals, and agricultural companies. In this case, an investor will have to take on significant market exposure from investing in the stock of the commodity producing company. In addition, the performance of the company depends on the movement of the price of the commodities it bases its sales on.

Option Three: Investing in Commodities Through Managed Futures or Index Funds — Managed futures is the most common method used for investing in commodities. In this case, actual physical delivery of the product can be taken but this is typically not standard. By using managed futures, an investor has the option of revolving a commodity continuously without ever having to take delivery of the physical commodity.

As with the purchase or sale of physical commodities, transactions in commodities through managed futures can also carry a high degree of risk, and a substantial potential for loss.

Stocks, Bonds, Bills, REITs, and Commodities

Commodities and REITs have traditionally served to lower the overall risk of a domestic portfolio.

This image illustrates the hypothetical growth of a $1 investment in domestic stocks, commodities, REITs, bonds, and cash over the time period January 1, 1980 to December 31, 2009. REITs were the best-performing asset class over this time period, with $1 growing to approximately $28.15. Stocks came in second, followed by bonds, commodities, and cash.

Commodities and REITs are often overlooked in a portfolio’s asset allocation decision. These assets can be excellent vehicles for diversification purposes, as their returns have demonstrated low or even negative correlation with more traditional assets. In other words, when traditional assets have done poorly, these alternative assets may have done well, thereby reducing the overall volatility (risk) of your portfolio.

Asset-Class Correlations

A well-diversified portfolio should consist of investments that behave differently.

Correlation is a statistical measure of one investment’s performance relative to another. Asset classes can be positively or negatively correlated, or have no correlation at all. Perfect positive correlation between two assets is represented by +100, while perfect negative correlation is represented by –100. Uncorrelated assets assume the value of 0.

Correlations for stocks, bonds, cash, REITs, inflation, and commodities since 1980

A well-diversified portfolio should consist of individual investments that behave differently. This table above illustrates the correlations for stocks, bonds, cash, REITs, inflation, and commodities since 1980. Analysis of historical data concludes that commodities have negative correlation to bonds and cash, and relatively low correlation to stocks and REITs.

While diversification does not eliminate the risk of investment loss, adding assets with low correlation to the existing assets in your portfolio may soften the impact of market swings, because they do not all react to economic and market conditions in the exact same manner.

Benefits of Including Commodities in a Portfolio

Historically, adding commodities to a portfolio comprised of stocks and bonds has reduced risk and increased return. This image illustrates the risk and return profiles of two hypothetical investment portfolios over the past 20 years. The domestic portfolio with commodities performed better than the domestic portfolio with only stocks and bonds, while at the same time assuming less risk.

By diversifying the original portfolio to include commodities, the overall risk of the portfolio was reduced and the overall return was increased — a win-win situation. Because traditional assets and commodities generally do not react identically to the same economic or market stimuli, combining these assets can often produce a more appealing risk and return tradeoff.

Risk and return of a portfolio with and without commodities

Commodities Serve as a Hedge Against Inflation

Unlike stock and bond returns, commodity returns tend to increase in periods of inflation. For example, when the demand for goods and services increases, their prices tend to increase as well. As a result, the demand and prices of commodities, which are used to produce these goods and services, rise as well. The table below represents the annual returns of stocks, bonds, and commodities since 1990. The change in inflation is represented by the percentage change in the consumer price index from one year to another. As seen in this table, commodities tend to perform better than stocks and bonds in the years when inflation is seen to have increased.

Stocks, bonds, and commodities returns versus inflation since 1990

Beating Inflation

It is impossible to predict which asset class will be the best or worst performing in any given year. The performance of any given asset class can have drastic periodic changes. The graph below illustrates the percentage an asset class beat inflation between January 1978 through December 2009, as measured by rolling six month periods. The Goldman Sachs Commodity Index beat inflation over 70% of the time during that period, followed by REITs at nearly 66% and stocks at over 60%. Surprisingly TIPS only beat inflation 52.6% of the time, but the TIPS universe was much smaller in the earlier years of this analysis.

Percentage of rolling six-month periods each asset class beat inflation, 1978-2009

Commodity Performance Over the Past 10 Years

It is impossible to predict which asset class will be the best or worst performing in any given year. The performance of any given asset class can have drastic periodic changes. This table below illustrates the annual performance of various asset classes in relation to one another. In times when one asset class dominates all others, it is easy to ignore the fact that historical data shows it is impossible to predict the winners for any given year.

Annual asset class performance including commodities

Investors betting on another stellar performance for commodities in 2001 were certainly disappointed, as small stocks rose from one of the worst performing asset classes in 2000 to the best performing one in 2001. Commodities were the top performer again in 2005, sank to the bottom in 2006, and came back to the top position once again in 2007. These types of performance reversals are evident throughout this example.

A well-diversified portfolio may allow investors to mitigate some of the risks associated with investing. By investing a portion of a portfolio in a number of different asset classes, portfolio volatility may be reduced.

Conclusions

Commodities have received attention in recent years as an asset class with potential to outperform traditional assets. Commodity-related investments can serve as a portfolio diversifier and enhance risk-adjusted returns.

Commodities have several characteristics that make them an attractive asset class to include in a portfolio. Portfolio diversification is enhanced when commodities are added to a traditional portfolio due to their negative correlations with stocks and bonds.

  • Low Correlation — Low to negative correlation with assets such as stocks, bonds, and REITs
  • Low to negative correlations between individual commodities
  • Attractive Historical Returns — Long-term returns similar to stocks
  • Moderately higher risk levels compared to stocks
  • Risk Reduction Through Portfolio Diversification — Including commodity allocation in a traditional portfolio can reduce volatility and improve diversification
  • Acts as an Inflation Hedge — Commodities typically tend to benefit from rising inflation

The positive historical performance of commodities relative to stocks with their moderate risk levels are a few reasons to consider commodities as an investment option. Unlike stock and bond returns, commodity returns tend to increase in periods of inflation. For example, when the demand for goods and services increases, their prices tend to increase as well. As a result, the prices of commodities which are used to produce these goods and services rise as well.

On account of these factors, an addition of commodity allocation may serve a portfolio well.

Macroeconomics: The World Economy

mac·ro·ec·o·nom·ics (mak-roh-ek-uh-nom-iks) — noun (used with a singular verb): “The branch of economics dealing with the broad and general aspects of an economy, as the relationship between the income and investments of a country as a whole. The part of economic theory that deals with national income, total employment, and total consumption.”

Macroeconomics is one of the most complicated and least understood branches of economics. Yet with the continuing, interconnected, globalization of the world’s economies, it is becoming one of the largest factors affecting investments world wide.

The “Rise of the Rest”

The “rise of the rest” is a remarkable achievement, bringing with it unprecedented improvements in living standards for the majority of people on the planet. But there is another, less happy, explanation for the rapid shift in the global centre of economic gravity: the lack of growth in the big rich economies of America, Western Europe and Japan.

Look at the world economy as a whole, and you could easily think that the recovery is in pretty decent shape. This week the IMF predicted that global GDP should expand by 4.8% this year — slower than in the boom before the financial crisis, but well above the world’s underlying speed limit of around 4%. Growth above trend is exactly what you would expect in a rebound from recession.

Yet this respectable average hides a series of problems. Most obviously, there is the gap between the vitality of the big emerging economies, some of which have been sprinting along at close to 10%, and the sluggishness of many of the rich countries from 0% to 2%. Research calculations from Harvard University and the National University of Singapore make the point starkly. They show that the average underlying annual growth rate of the G7 group of big rich economies between 1998 and 2008 was 2.1%. On current demographic trends, and assuming that productivity improves at the same rate as in the past ten years, that potential rate of growth will come down to 1.45% a year over the next ten years, its slowest pace since the second world war. A big difference from the sprinting 10%.

Are the “Haves” and “Have-Nots” Reversing?

Unless more immigrants are allowed in, or a larger proportion of the working-age population joins the labor force, or people retire later, or their productivity accelerates, the ageing population will translate into permanently slower domestic growth.

Comparative growth of emerging and developed economies

A World Out of Balance

In the emerging world the macroeconomic errors come from politicians behaving as if growth there were more fragile than it is. The pace has slowed a bit, but from breakneck speed to merely very fast. Most vital signs, from productivity to government debt, are healthy. Yet many policymakers are buying boatloads of dollars to stop their currencies rising as foreign capital pours in from Western investors seeking better returns. Emerging economies, as a group, still save more than they invest, which explains why global imbalances — notably the controversial surplus in China and deficit in America — remain so big.

Monsoon rains bring relief after the heat of summer but they can also cause flooding. A flood following a drought is a reasonable description of recent flows of private capital to emerging markets. During the worst of the crisis these flows collapsed, sending at least a few emerging economies into the arms of the IMF. Now, attracted by the developing world’s better growth prospects and exceptionally low interest rates in rich countries, money is surging back.

It is hard to know just how much cash is flowing in. Complete data on countries’ balance-of-payments positions are available only with a long time lag. An economist at Goldman Sachs has worked out a measure of net capital inflows from figures on countries’ foreign reserves and current-account balances. He reckons that flows into 20 big emerging countries are now running at a faster pace than before the crisis. According to his estimates, net capital inflows to these countries between April 2009 and June this year ran at an annualized pace of $575 billion, well in excess of average annual inflows of $481 billion in the two years prior to September 2008.

The economists note that the currencies of emerging Asian countries face the strongest upward pressure because of changes in the destination of private capital. As flows to Eastern Europe and Africa have shriveled, Asia’s share of the total flow of capital to the emerging world has gone from 61.3% in 2007 to 78.6% in the first half of 2010. Latin America’s share has also increased, from 15.2% to 20.9% over the same period. These are rising shares of a growing total, meaning that both regions are now getting more private capital than they were before the crisis. This effect is particularly strong for emerging Asia.

Private capital flows to emerging Asia and Latin America

Upward Pressure for One Currency Means Downward Pressure for Another

Not every emerging country’s currency is under the same kind of upward pressure. India, for example, seems not to have intervened much in the foreign-exchange market, but its currency has not moved much over the past year either. Part of the reason is that capital inflows have gone mainly to finance its persistent current-account deficit. By controlling for this kind of thing the analysts find that Malaysia and Thailand have had the most “appreciation-friendly” regimes in Asia. Malaysia has largely been content to let its currency float upwards. The ringgit has risen by over 10% against the dollar since the beginning of the year. Malaysia’s reserve accumulation has been much smaller in 2010 than in 2006. South Korea, by contrast, has been absorbing virtually all of the upward pressure on the won by accumulating additional reserves. Peru is the country that has been trying the hardest to prevent its currency from rising. Interventions by Brazil look relatively modest once its size is taken into account. Colombia has pretty much allowed its currency to rise.

In the rich world the danger is the reverse. Big asset busts are usually followed by years of weakness as the over-borrowed repair their balance-sheets. Experience suggests that several years of slow growth lie ahead. Rich countries are planning tax rises and spending cuts worth 1.25% of their collective GDP in 2011, the biggest synchronized fiscal tightening on record. In many places a budgetary squeeze is necessary, but not all; and, taken as a whole, cutting this much this early is a risk. Even if demand remains strong enough to cope with this onslaught, the rich world’s longer-term growth prospects are darkening.

Ten years ago rich countries dominated the world economy, contributing around two-thirds of global GDP after allowing for differences in purchasing power. Since then that share has fallen to just over half. In another decade it could be down to 40%.

The bulk of global output will be produced in the emerging world. Europe’s working-age population is about to start declining; Japan’s is already doing so. Even in America the ageing of the baby-boomers points to a slower-growing workforce. In theory, faster productivity growth could offset this, but in most rich economies that was waning before the crisis hit — and the crash has clobbered productive potential. A feeble recovery could make matters worse, as the unemployed lose their skills, public debt builds up and firms put off investment.

A gaping growth gap between the emerging and rich worlds will, of course, shift economic might more quickly towards emerging economies. A fast-growing emerging world is fine, but a stagnating rich one serves nobody — especially if trade tensions start to rise. Western voters may find it intolerable that the likes of China still run big surpluses, thanks in part to those weak currencies. Protectionist rhetoric is already rising in the United States. The “have-nots” are beginning to “have.”

From the Macro to the Micro

The world would be better served by policies that both improve rich countries’ prospects and reorient growth in emerging economies. These should come in two parts. First, macroeconomic policies must be recalibrated. Emerging economies need to allow their currencies to rise more. The rich countries should tread carefully with fiscal consolidation: sensible budget repairs should be less about short-term deficit-slashing and more about lasting fiscal reforms, from raising pension ages to trimming health-care costs.

Second, and just as important, is microeconomic reform. There is a crucial missing ingredient just about everywhere in the world: the “micro” structural reform of each country, without which current growth rates are unlikely to last. The structural reform needed is different for each country, and sometimes the complete opposite.

Many emerging economies are slow to let their currencies rise to reflect their strength, even as the fragile rich economies are embarking on austerity programs. No matter what Congress threatens about the Yuan, China’s trade surplus will not disappear until it boosts investment in services, removes distortions that depress workers’ share of income and encourages households to save less. From telecoms to insurance, China is full of service oligopolies that need to be broken up.

Similar growth tonics need to be applied in much of the rich world, both to boost domestic spending in surplus economies, such as Germany and Japan, and to raise productivity. America is more productive than the euro zone and Japan largely because the latter both have a lousy record in services (too many rules and not enough competition). Many labor markets also need an overhaul, especially in southern Europe, where it is still far too difficult to adjust wages or fire permanent workers. One advantage of the crisis for Spain and Greece is that they have been forced to make a start on this.

The United States also has its own microeconomic to-do list, albeit of a different sort. The most urgent item is the festering mass of underwater mortgages. Almost 25% of homeowners with mortgages owe more than their houses are worth. Faster, more thorough debt restructuring is needed, to make it easier for workers to move to where jobs are more plentiful and to hasten financial recovery. Schemes for unemployment insurance and training also need attention, so that high joblessness does not become entrenched.

None of these structural reforms is easy. Peer pressure could help. Rather than being fixated on harsher budget-deficit rules, the European Union’s members should pledge to complete the single market in services, to open up cozy national markets to greater competition. The members of the G20 big economies could commit themselves to specific structural goals, from raising retirement ages to deregulating things like transportation. A bold microeconomic agenda will not yield instant rewards. Nor is it a substitute for getting the macroeconomics right. But without it, global growth will eventually falter.

Faster growth is not a silver bullet. It will not eliminate the need to trim back unrealistic promises to pensioners; no rich country can simply grow its way out of looming pension and health-care commitments. Nor will it stop the relentless shift of economic gravity to the emerging world. It is unavoidable. Since developing economies are more populous than rich ones, they will inevitably come to dominate the world economy. (China has already overtaken Japan as the world’s second largest economy.) But whether this shift takes place against a background of prosperity, or stagnation, depends on the pace of growth in the rich countries. For the moment, unfortunately, too many rich countries seem to be headed for stagnation.

Portfolio Diversification

The Role of Asset Allocation

What Is Asset Allocation?

The asset-allocation decision is one of the most important factors in determining both the return and the risk of an investment portfolio.

Asset allocation is the process of developing a diversified investment portfolio by combining different assets in varying proportions.

An asset is anything that produces income or can be purchased and sold, such as stocks, bonds, or certificates of deposit. Asset classes are groupings of assets with similar characteristics and properties. Examples of asset classes are large-company stocks, long-term government bonds, and Treasury bills.

Every asset class has distinct characteristics and may perform differently in response to market changes. Therefore, careful consideration must be given to determine which assets you should hold and the amount you should allocate to each asset.

Factors that greatly influence the asset-allocation decision are your financial needs and goals, the length of your investment horizon, and your attitude toward risk.

Diversification Reduces Risk, But Does Not Eliminate the Risk of Investment Losses

Reduction of Portfolio Risk

Diversification is the strategy of holding more than one asset class in a portfolio in order to reduce risk. This image depicts the relationship between portfolio volatility, measured by standard deviation, and the number of asset classes in a portfolio. Standard deviation measures the fluctuation of returns around the arithmetic average return of the investment. The higher the standard deviation, the greater the variability (and thus risk) of the investment returns.

Portfolio volatility versus number of asset classes

You can limit the effect that any individual security or asset class may have on the performance of a portfolio by investing in a combination of asset classes. As a result, declines in the total returns of one or two assets may be offset by increases in others. Notice that as the number of randomly selected assets in the portfolio increases, the risk level decreases. While it is impossible to completely eliminate risk, diversifying your investments can reduce the overall volatility experienced by your portfolio.

Potential to Reduce Risk or Increase Return 1970–2008

Historically, adding stocks to a portfolio of less volatile assets reduced risk without sacrificing return or increased return without assuming additional risk.

The graph below illustrates the risk-and-return profiles of three hypothetical investment portfolios. The lower risk portfolio, which included stocks, had the same return as the portfolio comprised entirely of fixed-income investments, but assumed less risk. The higher return portfolio had the same risk level as the fixed income portfolio, but produced an increased return.

Although it may appear counterintuitive, diversifying a portfolio of fixed-income investments to include stocks reduced the overall volatility of a portfolio during the period 1970–2008. Likewise, it is possible to increase your overall portfolio return without having to take on additional risk.

Because stocks, bonds, and cash generally do not react identically to the same economic or market stimuli, combining these assets can often produce a more appealing risk-and-return tradeoff.

Risk and return of three hypothetical portfolios, 1970-2008

Effective Diversification Requires Combining Assets That Behave Differently

The Case for Diversifying

Diversifying your portfolio makes you less dependent on the performance of any single asset class.

Effective diversification requires combining assets that behave differently when held during changing economic or market conditions. Moreover, investing in assets that have dissimilar return behavior may insulate your portfolio from major downswings.

Annual returns of stocks, bonds, and a blended portfolio, 1956-1962

The graph above illustrates the annual returns of three different portfolios over a seven-year time period. Stocks represent a 100% investment in large-company stocks. Bonds represent a 100% investment in long-term government bonds.

When the stock and bond asset classes were combined into an equally weighted portfolio, the portfolio experienced less volatility than stocks alone and still maintained an attractive return. Notice that stock returns were up at times when bond returns were down, and vice versa. These offsetting movements assisted in reducing portfolio volatility (risk).

Past performance is no guarantee of future results. Time period illustrated is from 1956–1962. This time period was chosen as a dramatic illustration of stock and bond return behavior and how their often opposite movements reduced portfolio volatility. This is for illustrative purposes only and not indicative of any investment. An investment cannot be made directly in an index.

“The Free Lunch”

Stocks and Bonds: Risk Versus Return 1970–2008

An efficient frontier represents every possible combination of assets that maximizes return at each level of portfolio risk and minimizes risk at each level of portfolio return. An efficient frontier is the line that connects all optimal portfolios across all levels of risk. An optimal portfolio is simply the mix of assets that maximizes portfolio return at a given risk level. This image illustrates an efficient frontier for all combinations of two asset classes: stocks and bonds.

Although bonds are considered less risky than stocks, the minimum risk portfolio does not consist entirely of bonds. The reason is that stocks and bonds are not highly correlated; that is, they tend to move independently of each other. Sometimes stock returns may be up while bond returns are down, and vice versa. These offsetting movements help to reduce overall portfolio volatility (risk).

As a result, adding just a small amount of stocks to an all-bond portfolio actually reduced the overall risk of the portfolio. However, including more stocks beyond this minimum point caused both the risk and return of the portfolio to increase.

Efficient frontier of stocks and bonds, 1970-2008

More Assets Do Not Always Mean Greater Diversification

Holdings-Based Style Analysis Can Be Used to Determine Security Overlap

The graphs below illustrate two different equity portfolios that individually comprise four mutual funds. Each oval within the style box represents an ownership zone of a mutual fund, which accounts for 75% of the fund’s holdings. The level of diversification provided by each portfolio is quite different.

Holdings-based style overlap of two equity portfolios

The funds in Portfolio A significantly overlap with one another, which indicates that each fund may hold stocks sharing similar style characteristics. While some overlap is acceptable in a portfolio, too much of it defeats the purpose of using multiple funds to create a diversified portfolio. In contrast, Portfolio B contains funds that span across many different styles. While the holdings in Portfolio A are more concentrated in the giant and large-cap value and blend segments, the holdings in Portfolio B are widely distributed among different investment styles.

Asset-Class Winners and Losers

It is impossible to predict which asset class will be the best or worst performing in any given year. The performance of any given asset class can have drastic periodic changes. The table below illustrates the annual performance of various asset classes in relation to one another over the past 15 years. In times when one asset class dominates all others, as was the case for large stocks in the late 1990s, it is easy to ignore the fact that historical data shows it is impossible to predict the winners for any given year.

Annual asset class winners and losers

Investors betting on another stellar performance for large stocks in 1999 were certainly disappointed as small stocks rose from the worst performing asset class in 1998 to the best performing in 1999. Similarly, international stocks were the top performers from 2004 to 2007, but disastrously sank to the worst performing position in 2008. These types of performance reversals are evident throughout this example. A well-diversified portfolio may allow investors to mitigate some of the risks associated with investing. By investing a portion of a portfolio in a number of different asset classes, portfolio volatility may be reduced. Past performance is no guarantee of future results. This is for illustrative purposes only and not indicative of any investment. An investment cannot be made directly in an index.

Correlation Can Help Evaluate Potential Diversification Benefits

A well-diversified portfolio should consist of individual investments that behave differently.

It is possible to determine how closely two asset classes move together by evaluating their correlation. Correlation ranges from –1.00 to 1.00, with –1.00 indicating that the returns move perfectly opposite to one another, 0.00 indicating no relationship, and 1.00 indicating that the asset classes react exactly the same.

For example, small stocks and large stocks have risen and fallen to the same market conditions. Their high correlation suggests combining them may do little to lower the risk of a portfolio.

In contrast, the negative correlation of small stocks and intermediate-term government bonds illustrates the potential for better diversification. Investments still need to be evaluated for investor suitability, but understanding asset class behavior may help enhance the diversification benefits of investor portfolios.

Correlations between stocks, bonds, cash, REITs, inflation, and commodities

Diversification in Bull and Bear Markets

Diversification is the strategy of combining distinct asset classes in a portfolio in order to reduce overall portfolio risk.

The graph on the left illustrates the hypothetical growth of $1,000 in stocks, bonds, and a 50% stock/50% bond diversified portfolio, from 2002 to 2007. Stocks provide increased growth in bull markets. It is important to understand, however, that this greater wealth was achieved with considerable volatility in stocks compared to the diversified portfolio.

Hypothetical growth of stocks, bonds, and a diversified portfolio, 2002-2007

The significance of holding a diversified portfolio is most apparent when one or more asset classes are out of favor. The graph on the right illustrates the hypothetical growth of $1,000 in stocks, bonds, and in a diversified portfolio, between 2007 and 2008. Notice that by diversifying among the two asset classes, the diversified portfolio experienced less severe monthly fluctuations than stocks or bonds alone. While bond prices tend to fluctuate less than stock prices, they are still subject to price movement. By investing in a mix of asset classes such as stocks, bonds, and Treasury bills, you may insulate your portfolio from major downswings in a single asset class. One of the main advantages of diversification is that it makes you less dependent on the performance of any single asset class.

Diversification Can Limit Your Losses During a Severe Market Decline

Diversified Portfolios and Bear Markets

The benefits of diversification are most evident during bear markets. The graph below illustrates the growth of stocks versus a diversified portfolio during two of the worst performance periods in recent history.

Stocks vs. diversified portfolio during two bear markets

The blue line illustrates the hypothetical growth of $1,000 invested in stocks during the mid-1970s recession and the 2007–2008 bear market. The red line illustrates the hypothetical growth of $1,000 invested in a diversified portfolio of 35% stocks, 40% bonds, and 25% Treasury bills during these same two periods.

Over the course of both time periods, the diversified portfolio lost less than the pure stock portfolio. Over longer periods of time, the more volatile single asset-class portfolio is likely to outperform the less volatile diversified portfolio. However, you should keep in mind that one of the main advantages of diversification is reducing risk, not necessarily increasing return, over the long run.

Investor Behavior

Seeing Is Believing… Or Is It?

The graphic below is an illusion. When you look at the graphic in one place it appears to stop turning, while other areas continue to turn. Moving your eye to different sectors of the graphic produces the same result — the part of the graphic you are focused on stops turning while the remainder continues to turn.

Except for one thing… nothing in the graphic is really turning, is it? That’s what makes it an illusion. This tells us that we cannot rely on our perceptions, intuitions or gut feelings alone.

It has been shown that investors tend to rely on their perceptions, making the same investing mistakes over and over. Fortunately, studies by some of the leading academics in the field of behavioral finance have shown that investors’ irrational behavior tends to be systematic.

Virtually everyone reacts the same way when placed in certain situations. However, since they tend to do it systematically, it is possible to explain why they act in this manner.

The point here is that illusions must be identified early and counteracted in an appropriate manner.

Investment decisions are influenced by a number of emotional and psychological factors, and this has given rise to the field of behavioral finance. Researchers and academics in this relatively new field attempt to better understand and explain how emotions and perceptions influence investors and the decision-making process.

The Efficient-Market Theory

The efficient-market theory states that security prices efficiently incorporate all public information. Supporters of the efficient-market theory contend that if information about a particular security is publicly available to one investor, it is available to all investors. Consequently, the price of a security reflects its true investment value at all times.

Asset allocation relies on the fact that markets are efficient and that investors behave in rational, predictable ways. However, investors do not always behave rationally — rational behavior is not as widespread as one may believe. In fact, investors can actually end up being their own worst enemies.

Patterns of Investor Irrationality

Consider all of the complex financial decisions faced by investors today. Without experience in different market environments or knowledge of market history, how might many of these investors make their financial decisions? Potentially through their perceptions or based on their emotions. For this reason it is imperative that investors understand and combat the myriad of illusions they may be prone to.

  • Overconfidence: Rating oneself as above average when it comes to selecting investments.
  • Hindsight Bias: Believing that unpredictable past events, in retrospect, were obvious and predictable.
  • Short-Term Focus: Inappropriately focusing on short-term risk versus long-term risk.
  • Regret: Having illogical feelings of guilt because of a poor outcome.
  • Mental Accounting: Mentally compartmentalizing investments while ignoring the aggregate portfolio.
  • Hot-Hand Fallacy: Perceiving trends where none exist and consequently taking action on this faulty observation.

Overconfidence

When an investor suffers from overconfidence, he or she rates oneself as above average when making investment decisions. Being overconfident often leads to overestimating the probability of good outcomes.

Overconfidence can cause people to focus primarily on the upside of investments, while underestimating the probability of poor outcomes for events over which they have no control.

In many studies on this particular investor behavior, the following question is often asked: “Consider your driving ability in relation to others on the road. Are you a better driver than average?”

Most surveys show that 80% to 90% of drivers consider themselves above average; this is clearly impossible.

In “Behaving Badly,” a 2006 study conducted by Dresdner Kleinwort Wasserstein Securities Limited, 300 professional fund managers were presented with a number of questions, and one related to overconfidence. In an attempt to see just how over-optimistic fund managers were, they were asked: “Are you above average at your job?”

Some 74% of the sample thought themselves above average at their jobs. Many wrote comments along the lines of “I know everyone says they are, but I really am!” Of the remaining 26% most thought they were average, but very few, if any, said they were below average.

Overconfidence: False Perception

Consider the historical performance of emerging-markets stocks from 2003 through 2008. For the first five years, stocks in these regions produced impressive returns — generating double-digit percentage gains. Based on this stellar track record, what would a typical investor have expected in 2008? More of the same, correct? Well, 2008 has been quite dismal for investors in emerging-markets stocks, as they lost a little bit more than half of their investment — 53.2%, to be exact.

One period of returns may be enough to create overconfidence among investors. Investors should avoid overestimating their ability to predict future outcomes, basing their decisions on past trends or performance.

Concentrating on only the upside potential while dismissing the possibility of poor performance can be quite dangerous. It is important to take a long-term view when investing.

“Concentrating on only the upside potential while dismissing the possibility of poor performance can be quite dangerous.”
“Investors shouldn’t let short-term swings in the markets affect their view of the future.”

Overconfidence and false perception among investors

Hindsight Bias

When an investor suffers from hindsight bias, he or she believes that unpredictable events in the past were inevitable. Some psychologists refer to hindsight bias as the “I knew that was going to happen” effect. This is quite apparent every day after the stock market closes. Market analysts on television or through other media outlets explain with confidence why the market performed the way it did. Similar behavior is displayed by those covering sporting events: after a game has ended, there are people who claim the outcome was quite predictable.

If you can correctly recall your beliefs of the day before an event, you are in a minority. Most people can rarely recreate what they thought. Most are honestly deceived and exaggerate earlier estimates. Investors may become angry and regretful about failing to avoid what appears to have been an obvious outcome. This pattern of behavior often tends to promote another investor bias: overconfidence.

Many people claim to have seen the writing on the wall when it comes to various historical bubbles, such as the technology bubble of the early 2000s or the recent real estate bubble. However, when a so-called obvious bubble was beginning to take shape, it most likely would not have heightened and eventually burst if most people had known of the eventual outcome.

Short-Term Focus

When an investor suffers from short-term focus, he or she inappropriately focuses on short-term risk as opposed to long-term risk. Given today’s technology and instant access to information via the Internet, it is inevitable that many investors will check their investment performance on a frequent basis.

Most investors know why they are investing: they have long-term goals that they are trying to achieve. Yet, they often exhibit very short-term behavior, such as frequent trading and/or overreacting to the short-term volatility of investments. It is imperative that these individuals resist the temptation to behave as though their time horizon is far shorter than it truly is.

Short-Term Focus: Avoiding Potential Near-Term Losses

In a recent study by professors at the Anderson School at UCLA and the University of Chicago, respectively, a group of defined contribution plan participants were divided into two groups and each group was told they could choose between only two funds, A and B. They were then given some information about the historical returns of these funds and were asked to decide, based on this information, how much of their retirement money they would invest in each fund. The returns for the funds were derived from actual stock and bond returns. The manipulation in the experiment was the manner in which the fund returns were displayed.

One group was shown a distribution of one-year returns for both stocks and bonds. The other group was shown a distribution of 30-year returns. The academics predicted that subjects viewing the one-year chart would invest less in stocks than subjects viewing the 30-year return chart.

They based their forecast on the fact that the one-year chart accentuated the perceived risk of investing in stocks. They stated that over a one-year period, the likelihood of stocks underperforming bonds is about a third, while over a 30-year period the likelihood is about 95%.

The results found that the group looking at the distribution of one-year returns allocated their portfolios much more conservatively: 60% to bonds and 40% to stocks. In contrast, the group that saw the 30-year return distribution allocated their portfolios more aggressively: 10% to bonds and 90% to stocks. Exposure to frequency of returns tends to affect an investor’s tolerance for risk.

Short-Term Focus: Coping with Near-Term Fluctuations

It’s tempting for investors to monitor their investment accounts on a regular basis. Instant access to real-time quotes and a barrage of media reports on daily stock market fluctuations can make it difficult for investors with a long-term investment horizon to stay focused on their goals. In reality, these daily market movements may not be as extreme as they seem. As investors look longer term, their perception often changes.

Short-term market fluctuations can be quite volatile, and the probability of realizing a loss within any given day is high. However, the likelihood of realizing a loss has historically decreased over longer holding periods. The graph illustrates that while the probability of losing money on a daily basis over the past 20 years was 46%, the probability dropped dramatically when analyzing an annual time period — 25%. Periodic review of an investment portfolio is necessary, but investors shouldn’t let short-term swings affect their view of the future.

Regret

Investors often react in an emotional manner after realizing an error in judgment has been made. When an investor suffers from regret, he or she displays disproportionate and illogical feelings over a poor outcome.

The regret bias in investing

Regret: Action Versus Inaction

Consider the situation of each of the following investors. Investor A purchased shares in Company ABC on Jan. 1st. This investor consequently sold the shares at the end of April because of the flat performance of the company. Investor B considered purchasing shares in Company ABC on the same day Investor A sold his shares, but after much consideration decided to take a pass. As the chart illustrates, Company ABC performed extremely well from May through December. Which investor is unhappier as a result of their decision?

Logically, the economic outcome is the same and therefore both investors should have the same amount of regret. However, studies have shown that the regret of having done something (commission) is greater than the regret of not having done anything (omission). Therefore, Investor A experiences more regret than Investor B.

Regret of action versus regret of inaction

“Investors who regret the opportunities they missed tend to take more risks than people who regret attempts that failed.”
“When mental accounting gets in the way of making sound financial decisions, there’s a problem.”

In an unpublished study by two prominent academics in the field of behavioral finance, 100 wealthy investors were asked to bring to mind the financial decision they regretted most. The majority of participants reported their greatest regret was from something that they had done. Those who reported a regret of not having done something were shown to take on more risk. They generally held an unusually high proportion of their portfolio in stocks. In summary, people who regret the opportunities they missed tend to take more risks than people who regret attempts that failed.

Mental Accounting

When an investor suffers from mental accounting, he or she will mentally compartmentalize investments and not look at the portfolio as a whole. When mental accounting gets in the way of making sound financial decisions, there is a problem.

When clients view individual investments with a narrow perspective (in a vacuum) they are less likely to include various asset classes in their portfolios. This is especially evident when trying to explain the benefit of including international investments. They perceive these investments to be too risky and fail to consider the potential diversification benefit such an asset class can provide.

However, it is important to note that some mental accounting may be helpful for clients. For example, if it is helpful for clients to mentally account for investments in terms of the goals they are trying to achieve, such as retirement or college savings, mental accounting could be warranted. This may help force them to make periodic contributions.

Mental Accounting: Sum of the Parts

Different types of investments perform differently from one another, which has made it possible to lower the risk of volatile assets by combining them with other types of investments.

Individually, each component in a portfolio has its own risk and return characteristics. While the relative safety of bonds or cash may be comforting, these investments may not provide the long-term growth potential many investors seek. On the other hand, stocks may provide the greatest return, but they are more risky than bonds.

Focusing only on international or small stocks, for example, may leave investors feeling a little uncomfortable because of volatility. However, as the image illustrates, by concentrating on the whole portfolio, an investor would have experienced a risk level that was similar to bonds and yet would have achieved a return comparable to stocks.

Mental accounting and the sum-of-the-parts fallacy

Hot-Hand Fallacy

When an investor suffers from hot-hand fallacy, he or she perceives trends where none exist and then takes action on these erroneous impressions. People tend to look for patterns and attribute trends to methods other than simply chance.

The concept of “hot hand” is taken from a study done on the performance of basketball players. The study analyzed the outcomes of players’ shots in hundreds of games. While basketball fans believe that a player’s chances of hitting a basket are greater following a hit than following a miss, the study concluded that the outcomes of both field goal and free throw attempts were largely independent of the outcome of the previous attempt.

When selecting a money manager, a one-year return could cause investors to fire their current money manager in favor of the “hot” manager. This can lead to dangerous assumptions and predictions when investors should be focusing on the long-term track record of a particular money manager.

Hot-Hand Fallacy: Asset-Class Winners and Losers

It is impossible to predict which asset class will be the best or worst performing in any given year. The performance of any given asset class can have drastic periodic changes. This image below illustrates the annual performance of various asset classes in relation to one another over the past 15 years. In times when one asset class dominates all others, as was the case for large stocks in the late 1990s, it is easy to ignore the fact that historical data shows it is impossible to predict the winners for any given year.

Investors betting on another stellar performance for large stocks in 1999 were certainly disappointed, as small stocks rose from the worst performing asset class in 1998 to the best performing one in 1999. Similarly, international stocks were the top performers from 2004 to 2007, but disastrously sank to the worst performing position in 2008. These types of performance reversals are evident throughout this example.

A well-diversified portfolio may allow investors to mitigate some of the risks associated with investing. By investing a portion of a portfolio in a number of different asset classes, portfolio volatility may be reduced.

Hot-Hand Fallacy: Chasing Fund Performance

Investor return, also known as asset-weighted return, factors in the timing of investors’ purchases and sales. It takes into account the fact that not all of a fund’s investors bought it at the beginning of a period and held it until the end. Therefore, investor return depicts the return earned by a fund’s typical investor. Investor returns support the theories about investors’ poor timing.

Some fund companies develop numerous trendy funds that tend to attract investors chasing whatever is hot, and otherwise do little to encourage a long-term investment perspective. These types of funds tend to produce relatively poor investor returns. On the other hand, most funds with consistently superior investor returns are from shops that encourage long-term investing and discourage short-term trading.

Investor returns versus fund returns

Summary

As the preceding images and commentary illustrated, investor misconceptions can be quite dangerous. In explaining asset allocation concepts and constructing an asset-allocation policy, identifying and understanding such investor misperceptions is critical.

It is also essential to find techniques like strategic asset allocation and portfolio rebalancing to counter these misperceptions and to educate investors to view markets and investing in a more rational and productive manner.

Out of the Comfort Zone

Fear and Contrarian Investing in Uncertain Times

You may have found in recent months that simply checking the movements of the markets, or turning on a business news channel is an exercise in psychological discomfort. During periods like these, investors are bombarded with reasons to mourn recent losses and to fear for the future of their investments. This information overload combines with our human natures and fertile imaginations to create disaster scenarios that can have the steeliest captain of Wall Street cowering under his bed. Unfortunately, given enough fearfulness, investors may become too focused on avoiding a new catastrophe, and so let opportunities for long-term gain pass them by.

It’s easy to see how many of these emotions (especially those which occur along the bear-market slope of the graph) market participants have gone through over the past year. The question, for our purposes in this paper, is to analyze how these understandable (and, indeed, unavoidable) emotional states may impact our ability to follow through on the solid investment ideas that we formulate during more stable or positive periods in the markets. And that analysis must begin with a quick look at the evolutionary underpinnings of our emotional reactions.

When it comes to investing, it can be incredibly difficult to overcome our instincts and make smart decisions, especially during bear markets. This problem is exacerbated by the fact that we are also both social and emotional animals. Again, these are useful traits, but they can work against us in the investing world: the market is often driven by the herdlike movements of millions of investors, each reacting emotionally to turmoil.

Research in behavioral finance has shown a clear link between heightened emotional reactivity and below-average investment performance. While we know we should be dispassionate in our analysis of investment opportunities, we often make snap judgments using poor or irrelevant data. We want to make the same decisions that all other investors are making, because it makes us feel better (even though we know that the markets rarely reward those who do what everyone else is doing).

History shows us that, during market crashes, panics, and other extreme situations, making good decisions that serve our long-term interests means stepping outside of our “comfort zones.” This means ignoring the inner voice that tells us to remove all of our investments from a troubled marketplace and stash them in the metaphorical mattress until conditions improve. It means working against our tendency to remove all profit-driving risk from our portfolios and following everyone else into risk-free investments that may not even keep pace with inflation. It means maintaining long-term investment discipline while rationally determining which tactical adjustments to our overall portfolios may be most beneficial during the short-term. But most of all, it means ignoring our emotional responses in favor of our rational determinations.

Overcoming Our Programming

Evolutionary history is not the only pressure that urges most people into irrational investing behavior, or “following the herd.” Doing what everyone else is doing is also very comforting, and helps to reduce feelings of anxiety and conflict in our own minds. On the other hand, moving in a fashion contrary to the rest of the markets can make many investors feel very uncomfortable. Being one of only a few contrarian investors who are ignoring this week’s hot stock, or investing in a proven, old-line company is a much less pleasant feeling than putting your money somewhere that all of Wall Street is trying to buy; you may feel exposed and question your own judgment. After all, it certainly seems more likely that you are wrong, than that everyone else is.

Most of us are not looking for ways to make our lives more difficult. When we consider the problem rationally, though, it’s easy to see that the slow, careful, often contrarian path is the one that is most likely to help us reach our investing goals. Conducting in-depth, unbiased, fact-based research may not be as much fun as chasing hot stocks recommended by a television personality, but it’s the best method for achieving success in our investments. Below, we have listed some of the many strategies you can employ as you strive to act sensibly in a frequently senseless investing world.

On the Contrary…

If there’s one thing that the market has consistently rewarded, especially in times of crisis, it is the willingness to sell when most people are buying, and to buy when most are selling. In both cases, contrarian investors like these are providing liquidity to the market, while those who are on the other side of the transaction are using that liquidity. At moments when almost everyone in the market is seeking to buy, it’s very likely that the market is getting crowded and that values are overinflated. The most likely result is that many investments will lose value in the inevitable correction, and that those who invested near the peak will lose out. On the contrary, when everyone is selling, the odds are good that the market is entering a panic. In the wake of panics, the smart move is to identify assets that have been oversold, and strategically invest in those. Yet consistently, most trend-following investors don’t heed this advice.

Buying at the peak vs. selling at the panic

Many investors are well aware of these facts. Why, then, do they tend to buy and sell at moments when they should know they shouldn’t? As we noted above, a major component of this behavior is the fact that it simply “feels right”: buying a stock that has just experienced a significant run-up makes investors feel that they have placed their money into an asset that has a proven, winning record. Selling into a panic relieves the anxiety that an investor feels as he watches his portfolio’s value continue to fall. Sure, locking in losses hurts, but it may not be as distressing as not knowing how much farther down the bottom may be.

Unfortunately for these investors, true winners and losers in the capital markets are determined by future price movements, not what transpired in the past. Following the line of thinking described above means that many investors will find themselves using liquidity in both rising and falling markets. On the other hand, the contrarian investor who provides liquidity to the markets is buying assets “on sale” and selling them at a premium, pocketing the instinct-driven investor’s money at every turn.

Becoming a liquidity provider is not natural. It is, instead, a learned behavior, through which investors reassess their natural instincts, and reprogram the way in which they perceive investment opportunities.

Playing the Devil’s Advocate

Questioning our own values and assumptions is one of the best avenues through which to determine whether or not the faith you place in your assumptions is warranted. Here again, asking tough questions about our assumptions is not much fun. It’s far more satisfying to act on a hunch and anticipate a reward than it is to take the time to investigate the downside of your investment. If you need evidence of this, look no farther than the millions that people pour into lottery drawings every day, knowing that they have a far greater chance of being hit by lightning than winning the lotto.

Considering the opposing side of an investment thesis

In each of these cases, it is a good idea to understand the argument against your own preference. The object is not to make you so confused about the merits of your ideas that you become unable to act decisively. Rather, some limited consideration of the opposing side can help you to develop an additional level of conviction in your strategy (if that conviction was originally warranted), or to suggest caution if it turns out that your convictions aren’t as unshakeable as you had originally assumed. In fact, whenever you find yourself confronting what seems like a totally unambiguous investment situation, it’s probably a good idea to ask this question: if it were really that obvious, why is someone else on the other side of this transaction?

One recent situation in which money managers would have been well advised to consider the devil’s advocate position is the 2008 auction-rate securities crisis. Recall that this situation arose because many managers purchased these securities based on the perception (and recent market behavior) that auction-rate securities, which paid higher yields than a money market, also had the same tiny degree of liquidity. Meaning, they thought, that they could park funds in auction-rate securities temporarily, and earn more than they would with a traditional money market, without incurring greater risk that they would be unable to withdraw the funds in a timely fashion. As we know now, the liquidity risk was greater than they anticipated, and when buyers for these securities dried up, many managers found themselves unable to retrieve their funds. These managers would have done well to recall that there is no such thing as a free lunch, and that if something sounds too good to be true, it probably is. Auction rate securities, as it turns out, paid more than money markets because they were not, in fact, as safe.

What’s Your Timeframe?

  • Set Reasonable Expectations: Always remember that, in the absence of extraordinary good luck, portfolio strategies don’t work immediately. For most investors, whether institutions or individuals, the proper planning horizon may be decades long. Even shorter-term investments should be measured in years, and never in quarters or months. This simple concept is very difficult to maintain, especially in the face of the 24-hour business news cycle and the real-time data available to every investor over the Internet. Still, it is something that you should reinforce in your mind whenever you consider your overall portfolio.
  • Establish Benchmarks: When it comes time to review your portfolio with your investment advisor, the primary focus should be on evaluating how well the overall portfolio is tracking its designated goals. This approach can help to put poor (or uncommonly strong) short-term results in the proper perspective. Even if a portfolio or a particular investment strategy underperformed over the last quarter in relation to a benchmark or peers, it may be working as planned in context of your long-term portfolio goals. Remember that long-term investing is not a “winner-take-all” contest, and that your objective is not to “beat” other portfolios’ performance, but rather to ensure that your investments are on track to deliver the growth you expect, at an acceptable level of risk, within the time horizon you have set.
  • Customized, Diversified Solutions: Many investors find it easier to focus on the big picture when they utilize a well-diversified investment program. With proper diversification, the performance of a given portfolio segment or investment strategy is not a make-or-break affair for the overall portfolio. Recall, though, that while the inherent power of diversification helps to reduce volatility, it does not assure a profit or protect against loss in a falling market.

Indexes

This month’s KnowRisk topic may, at first, seem very simple. After all, even the most inexperienced investor knows what an index is. Checking to see how “the markets are doing” based on the movements of one of the popular stock indexes is water-cooler conversation in offices around the world.

But while all investors are familiar with indexes as a concept, how many truly know what is being measured by the various indexes that they consult for a snapshot of the overall markets? Is the index that investors use as a convenient measurement against which to judge their own portfolios’ performance the best available gauge of how those investments are doing? How do various indexes that are presumed to describe similar market segments really compare to each other, or to the segments they purport to measure?

This article seeks to answer these, and many other basic questions. We will discuss how indexes are constructed, the use and misuse of various indexes, the ways in which various indexes can overlap in unexpected ways, and other topics that will help you to understand and properly apply these important measurement tools.

Kicking the Tires

If you were asked to explain the concept of a car to someone who had never seen one, your task might seem straightforward. After all, there are certain key features that all cars share: a passenger compartment, wheels, axles, an engine, transmission, etcetera. With this description, your friend should be able to determine whether or not the next vehicle he sees is a car without too much trouble. But nothing about your description could help your friend determine whether the car in question is a huge SUV, like a Cadillac Escalade, or a tiny hybrid, like a Toyota Prius. In other words, your description will help your friend know that a car is not a bicycle, but it won’t help him to figure out what kind of car he should buy.

Similarly, we could probably all, if pressed, provide a general definition of what an index is. Something like: indexes are a statistical measurement derived by aggregating the change in value of a selected group of securities over time. And we could all probably name a few indexes off the tops of our heads: the Dow Jones Industrial Average, the S&P 500, the Russell 1000, the NASDAQ, and foreign indexes like Britain’s FTSE, Japan’s Nikkei, and Germany’s DAX.

However, just as was the case with cars, it is a mistake to think that defining the idea of indexes is the same thing as understanding how each is constructed, or that all of them are equally useful for any given application.

What Did the Market Do Today?

When talk around the aforementioned water coolers turns to how “the market” is doing, it’s a good bet that everyone understands this “market” to mean one of two indexes: The Dow Jones Industrial Average (“the Dow”), or the S&P 500. These are, by far, the most widely reported figures related to the financial markets, with their movements discussed endlessly in print and on television. But what, exactly, do these two indexes measure?

According to its parent company, Dow Jones, the Dow Jones Industrial Average includes 30 (though the real figure is currently 35) stocks selected by the editors of The Wall Street Journal, with the aim of “represent[ing] large and well-known U.S. companies.” Recent upheavals in the markets necessitated the removal and replacement of two of the Dow’s components, when Citibank and General Motors were replaced with Travelers Companies, and Cisco Systems, respectively. Normally, though, the lineup of stocks included in the Dow is very stable, and represents many of the most familiar companies in the U.S.

The other measurement people often refer to as the “market” is the S&P 500. While the Dow measures a select set of large-cap equities, the S&P includes 500 (actually, it can include as many as 507 — as of this writing, there are 504) stocks at all levels of capitalization, and therefore offers a considerably broader view of the market than does the Dow. In addition, the S&P is, unlike the Dow, a capitalization-weighted index. This means that the top 25 stocks by capitalization in the index are responsible for more than 50% of the overall index’s return.

While these two indexes tend to move in the same direction (their 3-year correlation is 0.98, their 5-year correlation is 0.97, and their 10-year correlation is 0.94), that correlation does not mean that the indexes’ movements have the same duration or magnitude. In addition, their composition is clearly very different. Those differences are only rendered more starkly when we compare the relative capitalizations and the style of their component companies.

In the charts above, we can clearly see that in addition to the huge difference in number of components that make up each of these indexes, there are significant differences in terms of the size and types of stocks they include. The most obvious difference stems from the fact that, while the Dow includes no mid- or small-cap stocks, fully 14% of the S&P at the time of this measurement was made up of stocks in these capitalizations. Moreover, while the S&P’s components are roughly equally distributed among value, core, and growth stocks, growth stocks represent less than 4% of the Dow, while core equities make up nearly two-thirds of the index.

Dow vs. S&P 500 sector weightings

Turning to the relative weightings that the Dow and the S&P have to each economic sector, we find a number of other significant disparities. Simply consider the 40.1% weighting that the S&P allots to the Service Economy, and compare it to the 28.3% weighting that the Dow assigns to the same sector. Digging deeper, we see that within the Manufacturing Economy, the Dow’s weighting in the Industrial Materials sector is nearly twice that of the S&P. Finally, the Dow includes no stocks in the utilities sub-sector at all, while they make up nearly 4% of the S&P.

Clearly, there are significant differences in the composition of these two indexes, each of which is used as shorthand for how “the market” is doing. But on the other hand, in spite of the public’s tendency to think of the movements of the Dow and the S&P as two versions of the same idea, these indexes were never intended by their designers to represent the same snapshot of the markets. What happens when we consider two indexes that are focused on the same market segments?

But Surely “Value” Indexes Are Basically the Same?

At first, it seems reasonable to assume that the various capitalization and style-specific indexes put out by different companies would be essentially the same. These more specific indexes include many that investors and advisors depend upon as benchmarks against which to judge the performance of specific managers. For example: if an investor is considering an allocation to a large-cap value manager, then he and his advisor would want to compare the performance and characteristics of the managers they scrutinize against those of a large-cap value index. But which large-cap value index?

Surely, as you move from broad-market indexes toward more specifically targeted indexes that focus on a particular capitalization and style, there should be increasing agreement about how best to represent those market segments in an index, right?

Russell 1000 Value vs. Dow Jones Large-Cap Value composition

Here again, our chart demonstrates that there are significant differences between two of the most popular large-cap value indexes, the Russell 1000 Value and the Dow Jones Large-Cap Value. Perhaps the most obvious and surprising difference is between the two indexes’ capitalizations. The Dow Jones Large-Cap Value index is almost entirely composed of large-cap, with a small portion allocated to mid-cap stocks. This mid-cap allocation is to be expected, as some of the stocks in the index will rise into large-cap status, or fall into mid-cap status, as their business improves or falters. More interestingly, though, we can see that the Russell 1000 Value has a small but significant allocation in the small-cap range, which may surprise investors who are looking to this index as a large-cap value benchmark.

This comparison is not intended to characterize one benchmark or the other as “superior.” However, for benchmarking purposes, it is entirely reasonable to think that they are unlikely to be equally applicable to any given manager’s or investor’s portfolio. For example — if you are considering a manager whose portfolio includes 45 stocks, and you are benchmarking him against the 500+ stocks in the S&P 500, how reasonable is that comparison? Are the sector weightings of the benchmark truly a good match for the weightings in an investor’s portfolio? Many investors would be surprised to learn that the benchmark against which they are measuring their returns allows weightings that would violate their portfolio’s investment policy.

Building Custom, “Blended” Indexes

Often, it is the case that there is no single index that provides a good benchmark for an investor’s or institution’s composite portfolio (that is, the diversified portfolio that results after the asset allocation and portfolio construction process have been completed). After all, most sufficiently diversified portfolios include not simply equities of all capitalization levels, but also fixed income investments and alternative investments of various kinds. Clearly, measuring such a portfolio against an equity-only index will produce a skewed view of its relative performance. For this reason, in investment consulting, we often create customized “blended” indexes that provide as close to an “apples-to-apples” comparison with the portfolio in question as possible. These combine the characteristics of several indexes that are each the best available match for a given portfolio segment, using relative percentages that mirror the appropriate allocations in the investment portfolio.

Below, you will find two charts that help to illustrate the construction of blended indexes. The chart on the left illustrates the asset allocation of a sample investment portfolio. In the absence of an established benchmark index that includes all of these asset classes in a similar ratio to that of the portfolio, a consultant might construct a benchmark index similar to the one pictured on the right. Note that, for each segment of the portfolio, the benchmark index includes a corresponding percentage of a comparable index.

Constructing a blended benchmark index

With this blended index, we seek to determine, as closely as possible, how well the overall portfolio is performing in comparison with an index that closely replicates its characteristics.

But Are You Truly Blending?

Earlier, we touched on the fact that some indexes include some surprising components — recall that the Russell 1000 Value, which is ostensibly a large-cap index, includes some small-cap stocks. Knowing, then, that an index’s name may not always provide a complete description of its components and construction, it may not be as simple as we might hope to create a truly diversified blended index. If you choose two indexes that would seem to cover completely different capitalization levels, for example, you may find a surprising amount of overlap between the stocks included in each. And if two or more of the various components of your blended index cover the same securities, then you may not receive the benefits that you were seeking by blending these indexes in the first place.

Equitas conducted an in-depth study of the Russell family of indexes, to determine exactly how much diversification could be achieved by combining them in various ways. The results were both surprising and illuminating. The graph below, which expands the traditional 9-box graphs we used earlier in this piece to include extremes of style (Deep-Value, High-Growth) and capitalization (Giant, Micro), is designed to illustrate the complete range of purchasable equities available in the U.S. market. Over this matrix, we have illustrated all of the stocks included in a given index, as plotted by their combination of style and size, at the time of measurement (in this case, 2006). Below, we see that the blue circle represents the Russell 1000, which is considered a core large-cap index. The tan circle represents the Russell Mid-cap, which is also a core index.

Russell 1000 and Russell Mid-cap index overlap

As you can see, the Russell Mid-cap index ranges up into the large-cap space, while the Russell 1000 dips deeply into the mid-cap space. Overall, these indexes feature a 28.9% overlap. In other words, nearly a third of all stocks included in one index are also included in the other. Anyone who constructs a blended index that uses both of these indexes is experiencing considerably less diversification among his large and mid-cap benchmarks than he might otherwise assume.

What if we focus on indexes that cover the same capitalization level, but different styles of stocks within those capitalizations? Specifically, let’s look at three Russell Mid-Cap indexes: the core-focused Mid-Cap Index we saw in the previous graph, alongside the Russell Mid-Cap Growth and the Russell Mid-Cap Value. What we might expect to see, based on these indexes’ titles, is a series of circles, each centered on the midpoint of the appropriate style column. What we see instead, though, is a series of ovals that extend far into the adjoining style columns, and produce a surprising degree of overlap with each neighboring index.

Russell Mid-Cap Growth and Value overlap
Russell Mid-Cap style overlap detail

Consider, based on these figures, how difficult it might be to achieve a truly useful blended benchmark for a portfolio that features both a core and a growth allocation in the mid-cap space using only Russell mid-cap benchmarks? After all, a huge percentage of the performance of each of these indexes is accounted for by precisely the same stocks. Obviously, knowing how much overlap there is between the indexes used to construct a blended benchmark is vital.

Exchange Traded Funds

Exchange Traded Funds, or ETFs, have become increasingly popular in recent years as vehicles through which investors can access the diversification of various indexes without incurring high management fees. Of course, this also means that investors who put their money into ETFs cannot depend on the experience and acumen of a manager with a talent for picking stocks — they are entirely subject to the movements of the components of the index. Moreover, while many investors assume that investing in an ETF means that they have invested in 100% of an index, the usual figure is closer to 80%. There are a number of reasons for this discrepancy, including liquidity issues: given the enormous sums that some ETFs have available to invest (in certain cases, in excess of $1 trillion), it can be impossible for them to invest in some of the smallest stocks in many indexes without artificially impacting the price of the stock in question.

Even with these caveats, though, ETFs can be an excellent tool for investors who seek exposure to alternative investments that might otherwise be hard to access. For example, what if an institution wished to have exposure to a natural resource, like timber, in its portfolio? Firstly, such an institution might consider a Real Estate Investment Trust that is focused on timber. But there’s also the option of investing in an ETF that buys timber-associated investments (paper companies, for example). These ETFs can offer exposure to an attractive sector for a comparatively low price.

Just as with any index, investors who are considering ETFs must ensure that they are fully aware of what, exactly, they are buying. If you are interested in gaining exposure to the growing “smartphone” market, you must keep in mind that these devices are considered “telecommunications”, and not “technology”, in spite of the fact that they sport many of the same features as computers. On the other hand, a “technology” ETF is likely to include software and peripherals manufacturers, in addition to chip and computer makers. Here again, truly understanding the index is vital to wise investing.

Fixed Income Indexes

When an investor purchases a bond, the principal underpinning the transaction is fairly simple: the government, corporation, or other entity that issues the bond promises to repay the money that the investor has loaned out by a specific date, and in the interim, the issuer will pay interest, usually twice per year. In essence, all that the investor in this scenario must concern himself with is whether or not the issuer will remain solvent, and be able to pay both the interest and the principal amount on schedule.

Of course, most fixed-income investors do not have such a simple relationship with their bond investments. Here, as with stocks, most institutional and individual investors achieve exposure to fixed income through either index funds or active managers. In situations like these, investors look to the characteristics of the overall portfolio (credit quality, maturity range, duration, etc.), in comparison with one of the standard fixed income indexes.

Again, just as with equity indexes, it is vital to know whether the composition of the portfolio in question is truly comparable to the benchmark index. For example, it is entirely possible to invest in an intermediate fixed income portfolio that has heavy weightings in bond classes that are simply not included in the benchmark. For example, a manager might decide to shift 66% of his portfolio into mortgage-backed securities, while the index against which he is measuring his performance contains little to no exposure to this sector. To draw a rough analogy, it’s as if an equity portfolio manager suddenly shifted 2/3rds of his portfolio into the tech sector. While this sort of tech sector overweighting might be possible in a small-cap growth portfolio, the distinction between styles of fixed income investing are not always so obvious to many investors.

Conclusion

Just like any tool, indexes can be used properly or improperly. Proper use of indexes as a benchmark against which to measure an investment’s characteristics and returns can help to determine which among a number of similar portfolios is the best choice for your investment goals. Choosing the wrong index, or the wrong combination of indexes, can obscure potential risks, or deliver apples-to-oranges comparisons that only make the process of evaluating investments more difficult. This is why it is vital to discuss your benchmarking options, along with all other facets of your investment strategy, with your advisor.

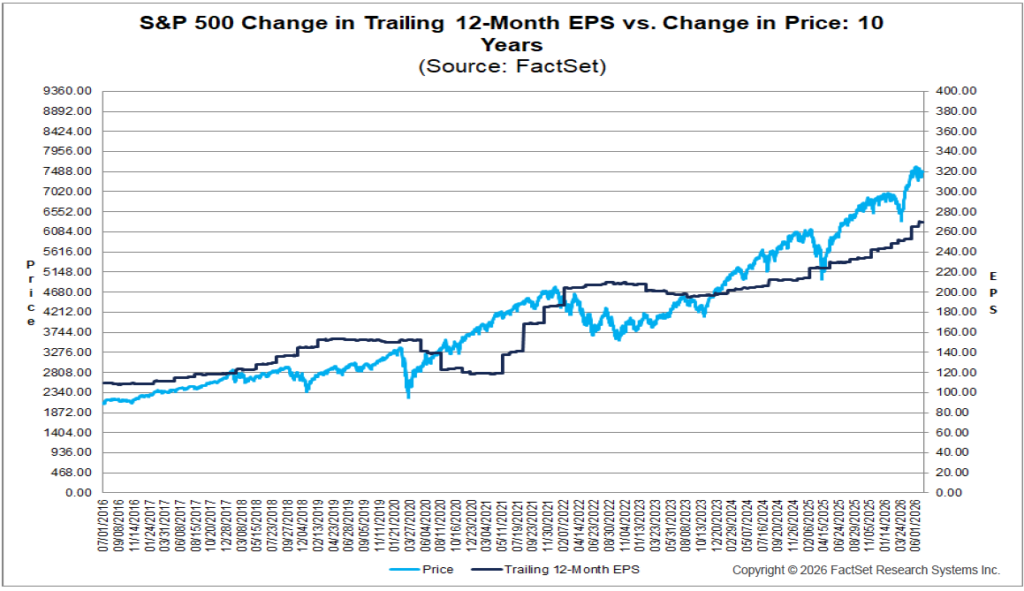
Downturns and Recoveries

This edition of Equitas’ KnowRisk series is focused on the history of stock market downturns, as well as the recovery periods that have followed. Clearly, every investor will read this information with an eye toward the precipitous declines that the markets experienced in the fall of 2008. For many investors, events like these can be hard to weather — and certainly there are many who have thrown up their hands in frustration in recent months. However, history teaches us that over the long term, markets tend not only to recover from even the most severe downturns, but to generate stronger returns over a long-term time horizon than any other investment.

Even though this history can be reassuring, it is important during periods of negative market performance to understand the effects, both long- and short-term, that downturns and recoveries have had on investments in the past. With that in mind, we turn to an exploration of market performance over the last few decades, leading up to the current turmoil.

Market Cycles Since 1973

As we are in the midst of a downturn that will (hopefully) soon lead to a recovery, it’s too early to draw any insight from the current market situation — history is still being written in each day’s market results. For that reason, the graph below is limited to a discussion of the seven market downturns that occurred during the past 34 years, ending with the peak of the last market expansion.

The areas shaded in red highlight the periods during which the stock market contracted, while the blue regions indicate the market’s expansion phases. For purposes of this graph, a “contraction” is defined as a time period during which the market declined from its peak by 10% or more, while an “expansion” refers to the period between the bottom of one contraction and the subsequent increase in market value up to the top of the next peak.

As you can see, the red, declining periods seem to occur at random, and their durations also vary widely. Certainly, none of these periods were pleasant ones for investors, and surely in the midst of the more protracted declines it seemed as if the bad times would never end. While it is too early to say when the current bear market may end, history shows us that there tends to be a significant opportunity for strong returns at the end of each down cycle.

Clearly, in spite of periodic setbacks, the market has grown over time. To take one example, the stock market fell from its peak at month-end May 1990 to its trough in October 1990 by -14.7%, but grew by 354.8% by the time it reached its next peak in June 1998. And while no one can predict the timing or severity of market declines with precision, investors who have clear, long-term-oriented goals, and who are not swayed by short-term trends have tended to be better off than those who focus on short-term gains or declines.

Market Downturns and Recoveries: 1926-2006

Here, we take a closer look at the severity and length of each major decline since 1926, as well as the amount of time required for the markets to reach their previous peaks. By studying this chart, we can see why even relatively brief downturns can have a significant short-term (and even medium-term) impact on investments, in spite of the markets’ tendency to generate strong returns over the long term. For each of the events in the chart, the red area indicates the length of the downturn period, while the blue area indicates the amount of time that elapsed before the markets again reached their pre-decline peak. For example, in the downturn that occurred in 1977-1978, the markets declined by 14.1% over the course of 14 months; however, once the recovery started, the market reached its previous highs after only five months of positive returns.

Length of downturns and recoveries, 1926-2006

While many of the downturns and recoveries illustrated here are relatively brief, there are two notable exceptions: the 1929 crash that inaugurated the Great Depression saw stocks lose more than 80% of their value — while the initial downturn lasted nearly 34 months, the markets didn’t see their previous peak again for more than 12 years. More recently, the market lost 44.7% of its value during the early 2000 bear market, and took just over 4 years to recover, which marked the second-longest recovery period in stock market history.

Here again, we can see the unpredictability of downturns, both in terms of length and severity — these events can be sudden, and are sometimes severe. Moreover, it is difficult to know how long the market will take to recover from each shock. The reasons for each downturn vary, though many are preceded by a period of high values that may lull many investors into a false sense of security. When suddenly faced with sharply negative returns, some of these recently complacent investors can behave irrationally if they are not focused on their long-term goals. In the face of uncertainty, the best solution for a long-term investor who is concerned about both returns and risk is a diversified portfolio.

Periods of Consecutive Negative Stock Returns: 1926-2007

Over the past eight decades, there have been only four periods during which the market has experienced negative returns for two or more consecutive years. While it is somewhat reassuring to note that consecutive years of negative returns are rare, the more important message here is that each of these periods has been followed by a year of above-average positive returns.

Periods of consecutive negative stock returns, 1926-2007

Investors who succumbed to the pain of multi-year losses on each of these occasions by deviating from their investment plans or liquidating their holdings would have missed the opportunity to enjoy the outsized positive returns generated during the first year of recovery. The lesson, then, is clear: while staying true to a long-term investment strategy during periods of negative growth can be difficult, pulling out of a down market guarantees not only that any losses will be permanent, but that a portfolio will not participate in any subsequent opportunities for recovery.

Clearly, maintaining a disciplined investment approach is a vital part of any strategy for handling market declines. In addition to maintaining a well-diversified portfolio, disciplined investing habits can include techniques like dollar cost averaging, a technique by which investors purchase a predetermined number of shares of a given stock at regular intervals, rather than making a lump-sum purchase. By easing into new investments in this way, investors can lower their cost basis (by purchasing more of a stock when it is down, and then less and less as its price improves); the technique also helps to remove some of the psychological barriers that can affect lump sum investing. By maintaining discipline in both portfolio balancing and entering new positions, investors maximize their opportunity to participate in any eventual recovery.

Trying to Time the Market

When investors withdraw money from the markets, and then re-invest it at a time when they feel more comfortable with market trends, they are attempting to time the market. We discussed the risks of market timing in an earlier edition of KnowRisk, but a series of studies by Dalbar, Inc. provides a particularly compelling example of how market timing can negatively impact an investor’s earnings over the long term.

Average mutual fund investor returns vs. the S&P 500 over 20 years

This chart illustrates the average returns for a mutual fund investor over a twenty-year period. At first glance, this seems almost impossible: how could the average investor have earned, on average, less than a 1% return after inflation, especially when the S&P earned nearly 9%, on average, each year? Surely, the average mutual fund could not have underperformed the index by such a wide margin.

The explanation for the disparity lies in the perils of market timing. Investors who remove money from the markets during down periods, only to reinvest it when they are more comfortable (typically when the markets are on an upswing), lock in their losses while minimizing their chance to enjoy the early days of a strong bull market. Giving in to fear during the worst of a given market cycle may have a significant impact on your ability to reach long-term investing goals.

Small and Large Cap Performance After Recessions

Small-cap vs. large-cap performance after recessions

Of course, when we discuss the historical phenomenon of stock market outperformance in the wake of downturns and recessions, that does not mean that all asset classes performed as strongly as others. This chart illustrates the average performance of two different groups of stocks in the wake of all recessions over the past six-plus decades. In each of the periods examined, small-cap stocks outperformed large-cap stocks, though both classes’ average performance was strong.

Small cap stocks are, of course, more volatile than larger-cap stocks. For that reason, many investors have tended to shy away from investing in this asset class. However, while investment planning that addresses volatility is important, fear of small-cap stocks may not justify omitting them from your portfolio: while small-cap stocks have not outperformed larger stocks after every recession, their average potential outperformance is significant. When investors consider strategies for a post-recession period, diversifying into small-cap stocks may be one option to which they should give special attention.

Crisis and Opportunity

As we come to the end of this installment of KnowRisk, we want to turn briefly to the current crisis, and to try to apply some of the lessons imparted by previous downturn and recovery periods in order to begin to see a way forward. As noted above, we cannot yet make too many definitive judgments about the length and severity of our current situation, but we can at least learn a few things about the risks and opportunities that even the initial downturn period of such a crisis can bring.

The chart on the left details the nine most volatile years since 1929 — note that 2008 is third on the list, its volatility exceeded only by two of the worst years of the Great Depression. 2008 saw nearly three times the number of volatile days (defined as a day on which the markets are up or down by 1% or more) than would be expected in any given year over that period (represented by the median figure of 47). But it’s important to remember that volatility can mean both losses and gains; the chart on the right notes that while 2008 saw two of the worst single-day losses in the last eighty years, it also saw two of the strongest days of gains.

Most volatile years since 1929, and best/worst single days

Certainly, these charts are not meant to indicate that losses and gains cancel each other out — clearly, investors lost far more during 2008’s down days than they gained on its up days. But these charts do illustrate an interesting point: even during a crisis in the markets, it can be difficult to say whether removing an investment on a given day could cause investors to miss out on significant gains as soon as the next trading day. Certainly, the same point applies to long-term investing. Recall the mutual fund example we used above: investors as a whole have historically gained far less, over the long term, by trying to time the markets than they would had they maintained their long-term investment discipline.

Using Discipline to Overcome Emotion

This final chart does not illustrate some numerical fact, or some quantifiable historical aspect of the markets. However, it does offer a convincing illustration of how emotional reactions to market turmoil can affect investors’ behavior, and thereby impact their returns.

The emotional cycle of market investing

This (admittedly unscientific) chart convincingly illustrates the emotional impact that different points in a market cycle can have on the average investor. The high point, “euphoria,” and the low point of “despair” represent the extremes of investor sentiment — what is notable about each is that, historically, they have been equally unwarranted. The euphoric reaction to the peak of a cycle can convince otherwise sensible investors to pour money into a market that is about to cycle downward, whereas despair at the bottom of a cycle can convince that investor to withhold his investments from a market that is poised to post strong gains. But consider the reactions that an investor may have to the other, less extreme points of this cycle: an investor in denial is unlikely to sell out of investments that are in free-fall, while a capitulating investor is likely to sell off his stake in firms that don’t have much further to fall. In the time that it takes for an investor to move from despair to hope, he may miss out on the strongest surge that a given bull market has to offer. As his enthusiasm for investing on an upswing turns to exhilaration, he is as apt to lose his long-term investment discipline as he is when he panics.

All of this history and discussion brings us back to the point of long-term investment discipline. While many institutions and individuals consider themselves to be disciplined, long-term investors, and have worked with their investment advisors to craft sound strategies that are designed to meet their long-term goals, it can be tough to maintain that discipline in the face of market upheavals. After all — we are all only human, and watching the value of a portfolio swing wildly up or down can make it difficult to maintain that discipline. But if there is one thing that you take away from this article, we hope it is this: for most investors, maintaining investment discipline, including regular portfolio evaluations that help to adjust investments to account for new market realities, is the most consistent and reliable way to reach their long-term investment goals.

Historical Perspectives

When the Levee Breaks: How History Can Help Us Understand the Recent Stock Market Crash

The chart above, which illustrates the unprecedented volatility that led to September and October’s tremendous destruction of investment wealth, has been a sobering lesson in how poor choices can cascade through the markets, wiping out nearly unimaginable sums in mere days. Every investor’s eyes have been glued to the seemingly unending stream of bad news coming out of the markets and broader economic indicators. Certainly, we would all prefer to avoid downturns like the one we have watched over the past few months; however, history shows us that any time we experience either a strong bull or a strong bear market, we should expect an eventual correction. And while we all hope that future corrections will be far less dramatic than recent events, keeping the cyclicality of the markets in mind can help us to fight the urge to stash all of our assets in the metaphorical mattress, or to bury them in the backyard.

While it’s certainly too soon for us to determine whether or not we have seen the bottom of this particular downturn, we wanted to discuss how and what we can learn from history during times like this. Also, we wanted to consider the question of why market crises appear to be getting more frequent and more dramatic, even as the underlying economy has become less volatile. Finally, we will discuss some of the ways that we can begin looking to the future, what we can do both to weather the current storm and to take advantage of opportunities once it has passed.

Inflation

This month, Equitas’ KnowRisk is dedicated to a discussion of inflation. In these uncertain times for investors, it is vital to understand what inflation is, how it can affect a portfolio, and some of the best ways to ensure that its negative impact on your investments is mitigated as much as possible. In explaining and examining the effects of inflation, we hope that you will gain a greater degree of understanding as to how inflation not only affects investors in terms of the return on their investments, but also as a factor in calculating what returns profile they need in order to retain and increase their purchasing power over time. With that in mind, let’s take a look at what inflation is at the most basic level.

Inflation, at Home and Abroad

Fundamentally, inflation is simply the inevitable increase in the price of essentially everything that we buy and sell over time. When your grandmother used to regale you with tales of purchasing a gallon of milk for a nickel, she was complaining about the effect that inflation has on prices. All economies are affected either by inflation or deflation of prices at any given time, and it is a vital consideration when constructing any investment portfolio. While recent inflation figures from the United States government have many investors concerned, it’s worthwhile to take a quick look at how inflation works in the rest of the world.

As you can see, while American inflation numbers (4.2%) currently exceed those in the developed economies of the Eurozone countries (3.7%) and Japan (0.8%), they are equal to those of Australia, and considerably lower than many of our most important trading partners, including Mexico (4.95%), India (6.02%), and China (7.70%). On the higher end of the scale, American inflation is less than a third what Russia is experiencing (15.1%), and even smaller when considered in light of Venezuela’s (31.4%) rate of inflation.

Risk and Volatility

KnowRisk is focusing on the closely interconnected concepts of risk and volatility this month. Risks come in many different varieties, with some affecting only certain types of investments, and others affecting nearly all investments across many asset classes. Creating an accurate picture of the risk level and the volatility that is inherent in any investment is a vital part of the investment process. In this article, we will define the different types of risk, examine the effect that each can have on different investments, and consider the best ways in which investors can mitigate these risks within their portfolios. By the end of this article, you should have a much better understanding of the way that risk affects your investments, and what you and your consultant can do to minimize the effect that those risks have on the long-term health of your portfolio.

Types of Risk

Industry/Company Risk — This risk rates the potential for any given security to decline due to negative developments within a specific company or industry.

Market Risk — This risk is particularly important when evaluating stocks, as general market fluctuations tend to cause these investments to fluctuate more than bonds and other asset classes, leading to potentially greater risk over short time horizons.

Credit Risk — This bond-specific risk measures the potential for a bond issuer to become unable to make timely payments of principal and interest; the value of bonds can also decrease should the issuer encounter financial difficulties or see its credit rating decline.

Interest Rate Risk — While this risk is greater due to the price volatility associated with longer-maturity bonds, all bonds tend to rise in value as interest rates fall, and vice-versa.

Reinvestment Risk — This risk can affect bonds with “call” provisions, in situations where falling interest rates cause the issuer to call in those bonds prior to their maturity. The risk here is that the investor could then be faced with the problem of having to reinvest the principal in bonds that offer a lower interest rate.

Inflation Risk — If investments do not keep up with the level of inflation (a rise in the overall price of goods and services), an investor’s money will purchase less in the future than it did in the past.

Currency Risk — As we discussed in last month’s KnowRisk, currency risk affects those who invest in foreign securities. As foreign exchange rates fluctuate constantly based on the supply of and demand for each country’s currency, the returns that local investors receive on a given investment are often quite different from those seen by U.S. investors, even though both are investing in the same security.

Political/Economic Risk — This risk broadly encompasses the potential for political and economic developments within a given country to impact investments in that country.

Market-Timing Risk — Investors who attempt to “time” the market (that is, to invest when they believe that the market is on an upswing, or removing investments when they believe the market is in a downturn) risk jumping into markets during the worst times, and/or not participating in markets during the best times.

Mitigating Industry/Company Risk: Stock Diversification

No matter how thorough the research that an investor or money manager puts in before purchasing a position in a company, there is always the risk that a given stock may fall in price due to non-market-related factors (such as poor company management). This is why diversification is such an important factor in creating a well-structured investment program. Given that company/security risk is simply the excess risk that investment in any given stock entails in excess of the risk level of the overall market (and that that risk is not always rewarded with higher returns), the best way for investors to mitigate this risk is by investing in a larger number of securities, across a number of industries.

In practical terms, the easiest way for most investors to reduce company/industry risk in their portfolios is by investing in mutual funds. Unlike individual investors, mutual funds command millions of dollars in assets, and therefore can afford to take positions in hundreds of stocks, thereby reducing the overall company/industry risk level. Individual investors rarely enjoy these economies of scale.

By including more securities in a portfolio, investors can reduce the level of company/industry-specific risk to which they are exposed. And while this is a particularly important consideration when investing in stocks, it also applies to investments in other asset classes. The graph above provides an illustration of how an investor who holds more than one hundred different stocks can reduce his company risk to a very low level.

Market Risk Remains. Unfortunately, even a well-diversified portfolio cannot remove the issue of market risk. Even if an investor holds every stock that’s available in a market, and is exposed to very little company-specific risk, he would still be exposed to the risk that the entire market will experience a decline in price. Some investors can mitigate this risk by investing in products that hedge against it. [1]

Risk Tolerance Spectrum

The trade off between returns and risk is fairly straightforward: as a rule, investors who desire high long-term returns must be willing to accept the high levels of volatility that are characteristic of the asset classes that produce such returns. On the other hand, if an investor is interested in lower levels of risk, he should be prepared to accept lower return levels on his investments.

In this example, we are defining risk as the fluctuations in returns between one period and the next. The risk levels associated with different asset classes vary widely: lower-risk investments, such as “cash equivalents” (a class including Treasury bills and certificates of deposit) have historically averaged modest long-term returns. Higher-risk investments (which include large-cap, small-cap, and international stocks) have historically averaged higher returns, but with greater volatility (fluctuations in value).

Risk/return spectrum by asset class

One of the first steps involved in developing an investment plan is determining which is more important: the stability of returns or long-term investment performance.

For example, as the above chart illustrates, cash equivalents like certificates of deposit (which are insured and offer a fixed rate of return), feature the lowest available level of risk, while also promising low levels of return. Slightly higher up the risk spectrum, government bonds (which are guaranteed by the full faith and credit of the U.S. government as to timely payment of principal and interest) promise slightly higher, but still low levels of risk and comparatively low returns. In considering stocks, it is worth noting that a large-cap domestic portfolio offers lower risk than international and small-cap stocks, though also the potential for lower returns. As noted above, international investments incur special currency risks, but also can be exposed to the potential for economic and political risks, foreign taxation, liquidity risks, and risk related to differences in accounting and financial practices among nations. For all of these reasons, domestic investors rightly expect the potential for higher returns to reward the increased level of risk they incur.

Asset Class Returns 1926-2007

As we’ve discussed, all assets involve some inherent degree of risk. However, some asset classes are considered more volatile (and therefore riskier) than others. One of the best ways to evaluate risk for an asset class is to look at that class’ historical returns. By gauging the highest and lowest returns that an asset class has experienced over a long-term historical horizon, investors may gain valuable insight into its demonstrated risk profile.

This graph illustrates the range of annual returns over the period 1926 through 2007 for five asset classes commonly considered during the asset allocation process.

Range of annual returns by asset class, 1926-2007

As we saw in the section above, the safest, most stable asset class has historically been Treasury bills — that stability is reflected here by their comparatively narrow range of historical returns. Note that both intermediate and long-term government bonds have experienced a wider range of returns than Treasury bills; this reflects the fact that longer-maturity bonds are more interest-rate sensitive, which tends to result in greater price volatility over time.

As expected, the asset classes that have the greatest range of returns/volatility historically are also the asset classes that have seen the highest compound annual returns: stocks, including both large- and small-cap equities. As expected, small-cap stocks are demonstrably more volatile than large-cap stocks, as the class is subject to significant price fluctuations and business risks, and are comparatively thinly traded. [2]

Reduction of Risk Over Time

In assessing the amount of risk, or volatility, that any investor is prepared to assume, one important consideration is the fact that the range of returns in a given asset class appears less volatile when considered over a longer holding period. This is a result of the fact that, over the long term, periods of high and low returns tend to offset each other. And with the passage of time, this offsetting effect results in the overall return dispersion gravitating toward the average of that class’ returns. In other words, while a given year’s returns may fluctuate widely, holding an asset for a longer period appears to result in decreased volatility.

Consider the graph below, which illustrates the range of compound annual returns for stocks, bonds, and cash over one-, five-, and twenty-year holding periods.

Range of compound annual returns over 1-, 5-, and 20-year holding periods

Take, for example, the large-cap stock asset class. Considered on an annual basis since 1926, the returns on large-company stocks have ranged from a high of 54% to a low of -43%. However, when considered over longer holding periods, the picture changes considerably. For example, the average returns range from 29% to -12% over five-year periods, and between 18% and 3% over 20-year periods. In addition, when considering the worst 20-year holding period for stocks since 1926, stocks still posted a positive 20-year compound annual return.

In conclusion, while stockholders can expect considerable short-term volatility, the risks involved in holding stocks appear to diminish with time. However, it is important to recall that holding stocks over a longer term does not ensure a profitable outcome, and investing in stocks always involves risk, including the possibility of losing some or all of the initial investment. [3]

Stocks, Bonds, Bills, and Inflation: Summary Statistics 1926-2007

The table below represents a quantitative summary of the risk/return tradeoff inherent in investing, which can be defined as the fact that as a rule, the potential return of an asset tends to increase along with the asset’s risk level. The “compound annual return” column reflects the annual rate of return that a hypothetical investment would have achieved over the entire 82-year period, assuming that the investor reinvested all dividend income back into the investment. The “arithmetic annual return,” represented in the second column, represents a simple, or arithmetic, average of the investment’s individual annual returns over the entire period.

Stocks, bonds, bills, and inflation summary statistics, 1926-2007

Inflation Risk: Stocks Versus Fixed Income

Best and worst inflation-adjusted returns over 20-year rolling periods

The table above illustrates the best and worst average inflation-adjusted returns for four asset classes over 20-year rolling periods. The term “rolling period” returns describes a series of overlapping contiguous periods; for example, when examining 20-year rolling periods for annual return data that begins in 1926, the first period is 1926-1945, the second period is 1927-1946, the third is 1928-1947, etc.

Examining this table, we can see that fixed-income asset classes have experienced very modest real (that is, inflation-adjusted) 20-year rolling returns: 2.9% for Treasury bills, and 8.6% for government bonds; in addition, these classes have each shown negative real returns over certain 20-year periods. On the other hand, stocks have historically exhibited positive real returns over 20-year periods. Historically, then, investors would have been less likely to lose purchasing power over the long run by investing in either large-cap or small-cap stocks instead of fixed-income investments. [5]

Fixed Income Maturity Risk

When interest rates fall, bond prices rise, and vice versa. The amount of fluctuation when interest rates move is called maturity risk. The longer a bond’s maturity, the greater the maturity risk.

For purposes of this table, each annual period from 1970 through 2007 was categorized either as a year in which yields rose, or a year in which yields fell. Then, we averaged the price changes for all positive years, and separately averaged the price changes for all negative years. The effect of this calculation was to isolate price change from total return, in order to emphasize the effect of maturity on interest rate sensitivity.

Fixed income maturity risk, 1970-2007

While shorter maturity bonds have been relatively insensitive to movements in interest rates (dipping an average of -1.3% in negative years, and gaining an average 1.6% in positive years), bonds with longer maturities have been far more sensitive (dropping an average of -7.7% when interest rates have risen and gaining an average of 9.2% when interest rates have fallen). [6]

Liquidity Risk

As noted above, “liquidity risk” refers to situations in which there is insufficient demand for a security. When this happens, that security may be difficult to sell on the open market, and its price can drop significantly.

We looked over the average trading volume for all large-cap, mid-cap and small-cap stocks, and calculated the average trading volume of each group. The average trading volume of the large-cap stock category was 4.10 million, while mid-cap stocks averaged 1.70 million, and small-cap stocks averaged 0.33 million.

These numbers demonstrate the fact that, as a rule, large-cap stocks are less subject to liquidity risks than are mid-cap stocks, which are similarly less subject to liquidity risks than are small-caps. This makes intuitive sense: after all, given that large-cap stocks are held by a wide range of shareholders and tend to be heavily traded, investors are likely to be able to sell their position at their desired price. Conversely, small-cap stocks tend to be less widely held and more lightly traded, and may not be well-known by the public. These factors tend to make it more difficult for investors to sell small-cap shares at the prices they seek. In fact, in situations where prices are declining, investors may not be able to sell their shares at all.

Some historical performance results show that the average rate of return for stocks has been higher for small companies than for large. There may be a greater potential for growth with small companies, but investors should be aware that there is also a greater risk of loss.

Market-Timing Risk

As we noted at the beginning of this article, market-timing risk (which is incurred by investors who attempt to time their purchases and sales of securities based on predictions about near-term market movements) runs the risk of missing periods of exceptional returns. This practice may have a negative effect on a sound investment strategy.

Over the period examined in this chart, it is clear that missing the one best-performing month during a given year would have vastly reduced returns for a hypothetical portfolio. Even in years that resulted in negative returns, missing the best month only exaggerated portfolio losses. In five of the 38 years shown (1970, 1978, 1984, 1987, and 1994) otherwise positive returns would have been dragged into negative territory should an investor have missed the best-performing month.

Although successful market timing may improve portfolio performance, it is very difficult to time the market consistently. On the other hand, unsuccessful market timing can have a significant negative impact on performance.

Effect of missing the best-performing month, by year

International Investing

This month, the KnowRisk series turns its attention to the subject of international investing. As the economies of countries around the world have become increasingly interdependent, taking an international perspective has become vital to the health of any investor’s portfolio. In this article, we will take a look at international investing from a number of perspectives, examining the sheer size of the opportunities available in non-U.S. markets, how countries’ GDP figures can indicate the health of potential investments in that region, how annual U.S. market returns stack up to those of other nations, and how including international investments in your portfolio may help to lessen overall portfolio risk.

Why Bother Investing Internationally

By now, everyone has heard so much about the phenomenon of globalization that for many, it has simply become background chatter. It’s no surprise these days to hear that foreign companies are building a manufacturing presence in the United States (think of the foreign-owned auto plants that have sprung up around the southern states since the early ’90s, or the refrigerator plant that the Chinese company Haier is expanding in South Carolina). Still, many investors have yet to apply these well-known trends of the modern marketplace to their own investment portfolios.

There are many reasons why any investor should consider investing in international equity markets. In fact, as the chart above demonstrates, an investor who limits him or herself to only U.S. stocks misses out on more than half of the available investment opportunities in the developed world. And because these are companies that are based in advanced countries with well-established markets (some of which are actually older than the U.S. stock market), investing in companies based in the countries listed in the chart above does not add high levels of country-based risk to a portfolio. With non-U.S. developed markets representing $22 trillion of the total $39 trillion in stock market capitalization in the developed world as of 2007, it’s obvious how many more opportunities are available to an investor whose view of developed-market opportunities extends beyond the borders of the United States.

Long-Term Investment Performance

Basic statistical analysis of historical asset returns can reveal the growth rate of wealth invested in an asset class or portfolio and the riskiness or volatility of asset classes.

Measuring Long-Term Market Performance

Compound Annual Return — The compound annual return is measured by geometric mean. It measures the average performance of an asset or portfolio over a given time period. In other words, it is a backward-looking statistic that determines the change in wealth over more than one period.

Arithmetic Mean — The arithmetic mean is just the simple average of returns. This measure of average better represents typical performance over single periods.

Risk — Risk is measured by standard deviation. It measures the fluctuation of returns around the arithmetic average return of the investment. The higher the standard deviation, the greater the variability (and thus risk) of the investment returns.

Types of Asset Classes

Stocks

  • Large Stocks
  • Small Stocks
  • International Stocks

Bonds

  • Government Bonds
  • Corporate Bonds
  • Municipal Bonds
  • High-yield Bonds
  • International Bonds

Cash Equivalents

  • Money Market Funds
  • Treasury Bills
  • Certificates of Deposit

Hard Assets

  • Real Estate
  • Commodities
  • Gold

Long-term investment performance by asset class